Nasdaq 100, Dow Jones and S&P 500 Forecast: Inflation Shakes Wall Street as Elliott Wave Signals Diverge
- US producer prices rose sharply in September, intensifying inflation concerns and pressure on technology shares.
-
Nasdaq 100 remains in a bearish Elliott Wave impulse, with a possible wave (iv) recovery before further weakness.
-
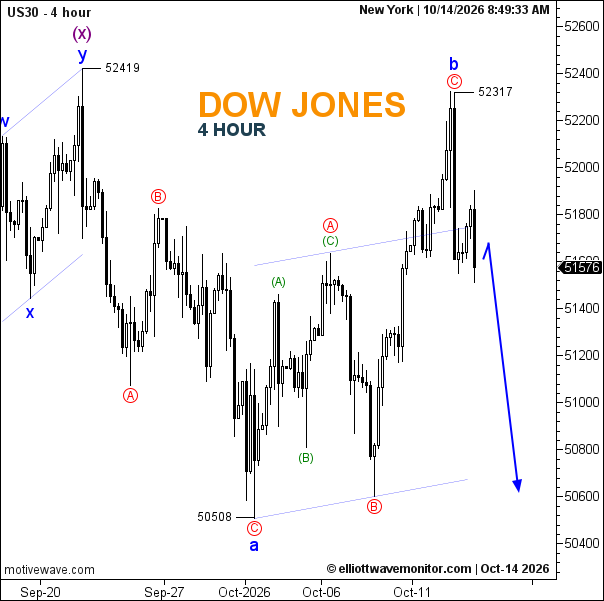
Dow Jones faces a potential decline toward 51,000, while the S&P 500 may attempt one final advance before a larger correction.
Wall Street News: Producer Inflation and AI Stocks Drive Market Volatility
US equities traded unevenly on October 15, 2026, as investors reassessed the Federal Reserve's interest-rate outlook following another unexpectedly strong inflation report.
September's Producer Price Index increased 1.3% month over month and 6.3% annually, according to data reported by Reuters. Higher energy costs contributed significantly to the increase, reinforcing concerns that inflation pressures were spreading through the economy.
Retail sales also rose 0.8% in September, suggesting resilient consumer spending despite elevated prices. However, the stronger figures complicated expectations for future interest-rate decisions.
The latest data followed Wednesday's consumer inflation report, which showed annual CPI rising 3.7%, above the expected 3.6%. That release triggered selling in interest-rate-sensitive growth companies.
Technology and semiconductor stocks remained under pressure on Thursday. Reuters reported losses among major chipmakers, including Nvidia, AMD and Micron, as investors questioned the financing costs and sustainability of expanding artificial-intelligence infrastructure.
Nevertheless, weakness was not uniform across Wall Street. Investors rotated toward defensive sectors and established industrial companies, helping the Dow Jones outperform technology-heavy benchmarks.
This divergence is reflected in the three Elliott Wave charts: Nasdaq displays a comparatively advanced bearish impulse, while the Dow and S&P 500 retain different corrective possibilities.
Nasdaq 100 Elliott Wave Analysis: Wave (iv) Recovery Before Another Decline
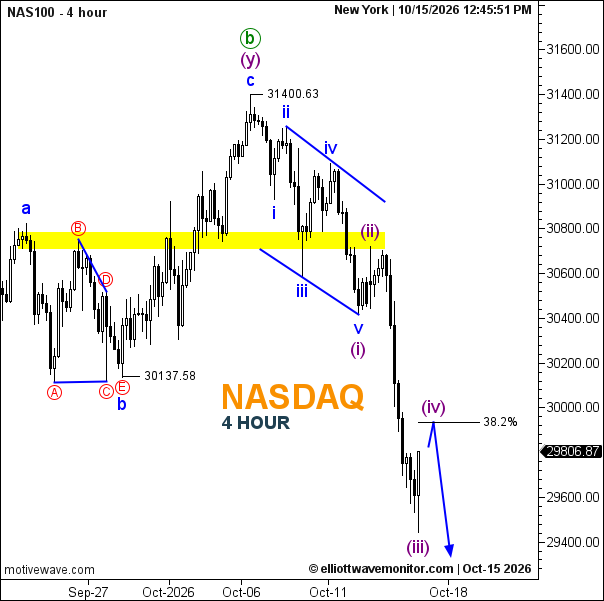
The Nasdaq 100 four-hour chart records 29,806.87 at 12:45 p.m. New York time.
The previous advance completed a higher-degree wave (b) near 31,400.63, followed by a five-wave decline.
Within this structure, wave ii formed a recovery, wave iii extended downward, and wave iv developed as a corrective rebound before wave v completed the smaller wave (i).
A subsequent recovery marked wave (ii), followed by renewed selling into wave (iii), which appears to be approaching completion.
The preferred scenario anticipates a corrective wave (iv) rebound toward the 38.2% retracement area near 30,000, followed by another decline within wave (v).
A sustained recovery above the developing wave (iv) region would weaken the immediate bearish continuation, while a move above 31,400.63 would invalidate the larger proposed bearish sequence.
Dow Jones Elliott Wave Analysis: Resistance Near 52,317
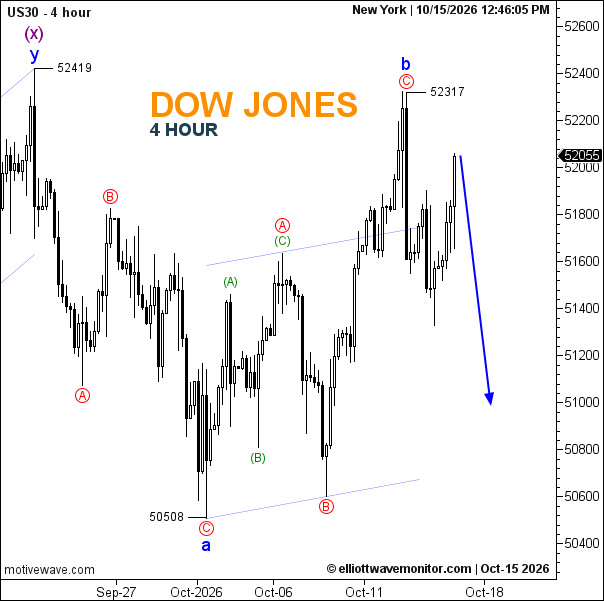
The Dow Jones chart shows 52,055, following a recovery from the earlier low at 50,508.
The advance reached 52,317, labeled wave b in the larger corrective structure. The subsequent fluctuations suggest that the recovery may be losing momentum.
The preferred scenario anticipates renewed weakness toward approximately 51,000, consistent with a developing downward wave after the corrective high.
A sustained break above 52,317 would invalidate the assumption that wave b has already completed and favor a continuing recovery.
S&P 500 Elliott Wave Analysis: Final Wave (v) Still Possible
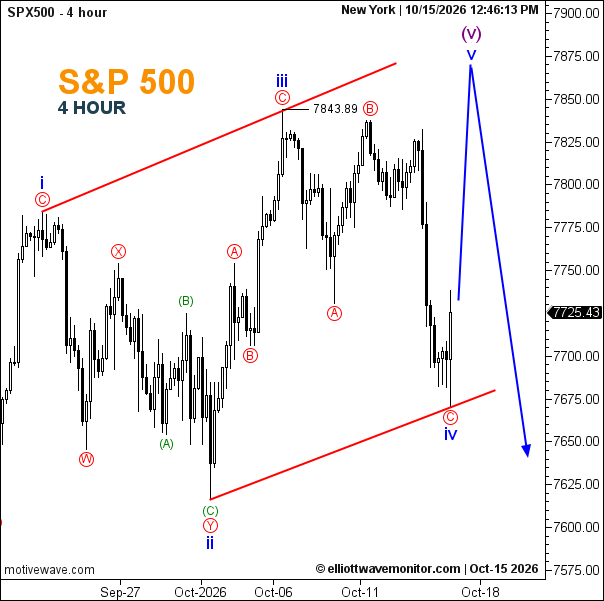
The S&P 500 trades at 7,725.43 on its four-hour chart.
The earlier advance reached 7,843.89, labeled wave iii. The latest decline has approached the lower boundary of the rising diagonal structure, suggesting that wave iv may be nearing completion.
If support holds around 7,650–7,675, the index could recover toward 7,875, completing wave (v) of the larger formation.
The alternative is an immediate breakdown below the lower diagonal boundary, which would weaken the final-rally scenario and favor a deeper correction.
US Indices Outlook
The technical outlook remains divided. Nasdaq's bearish impulse appears more developed, the Dow faces resistance below 52,317, and the S&P 500 retains a conditional final-wave recovery.
Further inflation surprises, Federal Reserve commentary and developments in AI-related equities could determine whether these projected Elliott Wave structures unfold.