EUR/AUD maintains a bearish daily outlook, with the chart showing 1.58549 following a sustained sequence of lower highs and lower lows. The user-labeled Elliott Wave structure shows purple wave (c) completed near the October rebound, followed by a decline into blue wave (i). The annotated scenario anticipates a corrective blue wave (ii) toward the 50.0% Fibonacci retracement near 1.6070, before renewed selling pressure potentially carries the pair toward 1.5800. The chart identifies 1.62663 as the broader bearish invalidation level. A recovery above the projected retracement zone could weaken the immediate continuation scenario, while the anticipated wave (ii) rebound remains unconfirmed.
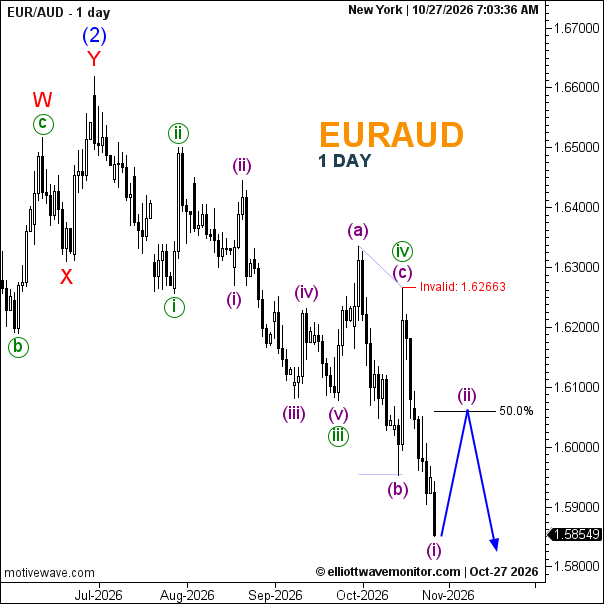
Technical Summary of EUR/AUD Price for October 27, 2026
-
Trend: Bearish.
-
Current Elliott Wave: Blue (i) labeled; blue (ii) projected.
-
Key Support Levels: 1.58549; approximately 1.5800.
-
Key Resistance Levels: Approximately 1.6070; 1.62663.
-
Next Price Target: Approximately 1.6070 corrective rebound, followed by 1.5800.
-
Invalidation Level: 1.62663.
-
Fibonacci Levels: 50.0% retracement near 1.6070.
Trader's Question: Can EUR/AUD recover toward Fibonacci resistance before resuming its decline?
The projected path favors a corrective rebound toward 1.6070, followed by renewed downside pressure. A sustained move above 1.62663 would invalidate the annotated bearish scenario.