
Key Points
- Gold extended its decline after completing a corrective fourth-wave recovery.
- The latest wave count identifies a new low at $3,832.33.
- Fibonacci retracements frame the next potential rebound before further selling.
Gold Price
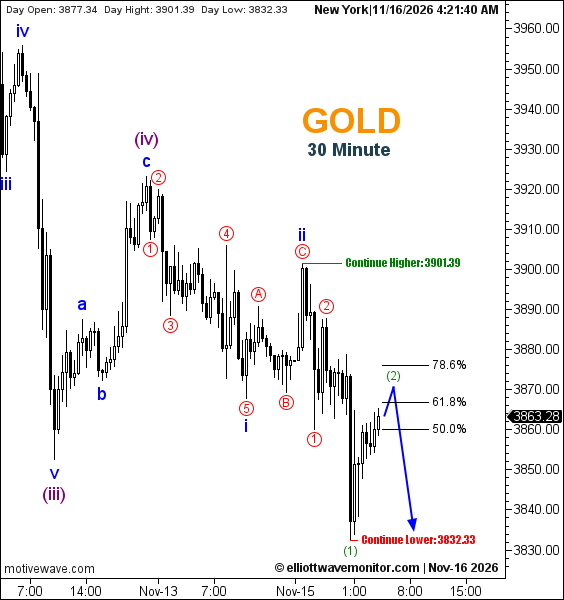
XAUUSD traded at $3,863.28 at 4:21 a.m. New York time. The November 16 chart recorded a daily high of $3,901.39 and a low of $3,832.33.
Gold Elliott Wave Analysis
The corrective recovery anticipated in the November 13 New York session outlook has given way to another bearish extension.
The updated structure places purple wave (iv) within the completed price action, followed by a decline that has established green wave (1) at the latest trough.
Attention now turns to a potential green wave (2) recovery, with the 50%, 61.8%, and 78.6% Fibonacci retracements defining the corrective reference levels.
The projected path subsequently favors renewed downside, although the rebound remains incomplete and no explicit invalidation threshold is marked.
Technical Analysis — November 16, 2026
- Trend: Bearish, M30.
- Wave Structure: Green (2) potentially developing.
- Key Low: $3,832.33.
- Fibonacci: 50%, 61.8%, 78.6%.
- Outlook: Corrective recovery before further downside.
Trader's Question: Would reaching the 78.6% retracement confirm a bullish reversal?
No. A deep retracement can remain corrective. The existing bearish structure would require further reassessment rather than treating that Fibonacci level as automatic confirmation of a reversal.