
Gold (XAUUSD) is trading at $3,883.74 on the 30-minute chart as of 9:52 a.m. New York time, up 0.17% from the daily opening price of $3,877.34. The metal has recorded an intraday high of $3,901.39 and a low of $3,832.33, producing a trading range of $69.06. Price has recovered from the session low, although the broader bearish structure remains relevant.
Gold Elliott Wave Analysis – M30
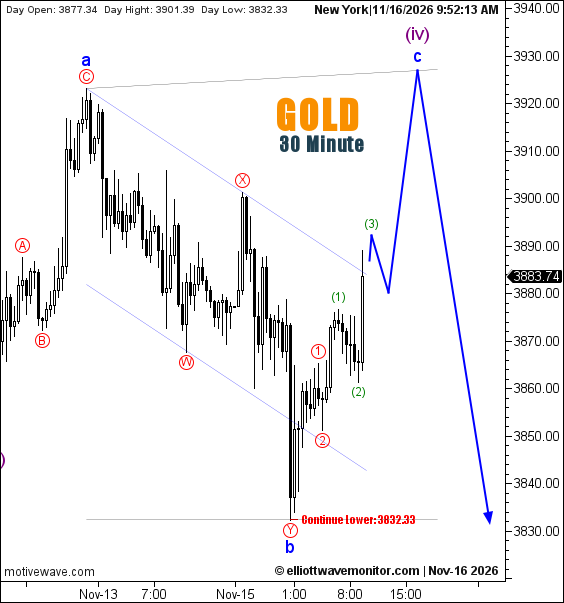
The latest chart introduces a revised Elliott Wave interpretation of gold's recovery from $3,832.33. The earlier November 16 analysis identified that low as the potential endpoint of green wave (1), with a green wave (2) rebound expected toward Fibonacci resistance.
The updated count instead places blue wave b at the same low, alongside the completion of the red circled W–X–Y correction, following blue wave a at the November 13 high.
The recovery now develops toward projected blue wave c and purple wave (iv), with red circled waves 1 and 2 and green waves (1) and (2) already labeled within the emerging advance. Green wave (3) remains projected, while the blue path anticipates a temporary pullback before a further rise toward the upper boundary of the descending channel, near $3,930. This would represent a corrective recovery rather than a confirmed bullish reversal.
Once purple wave (iv) is complete, the drawn path favors renewed selling toward $3,832.33 and potentially below it. A break beneath that low would meet the chart's downside-continuation condition, while completion of the projected recovery remains unconfirmed.
Trader's Question: Does gold need to break above $3,901.39 to complete the projected wave (iv)?
The drawn path anticipates a recovery beyond the current intraday high toward the upper channel boundary, but $3,901.39 is not designated as a formal confirmation threshold. Wave (iv) completion remains conditional on the developing Elliott Wave structure.