
Key Points
- Gold's anticipated corrective rebound has materialized.
- Green wave (2) is now marked near the 78.6% Fibonacci retracement.
- Renewed downside remains the primary projected path.
Gold Price
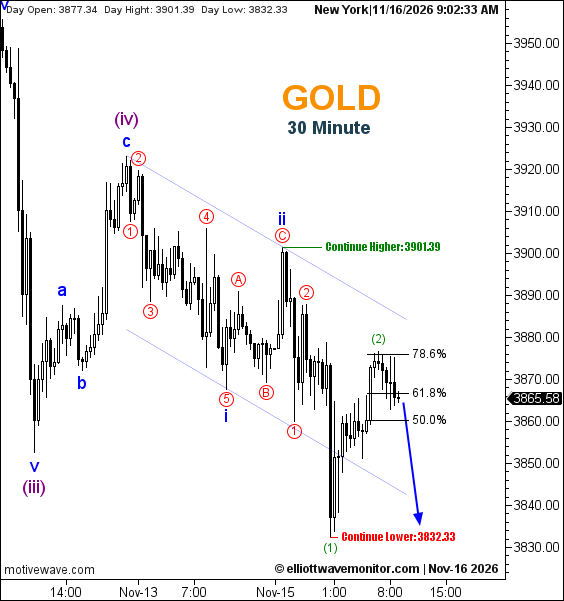
XAUUSD traded at $3,865.58 at 9:02 a.m. New York time, retreating from its corrective recovery. The chart shows a daily range between $3,832.33 and $3,901.39.
Gold Elliott Wave Analysis
The recovery anticipated in the earlier November 16 gold forecast has developed toward the 78.6% Fibonacci retracement, where the updated Elliott Wave count places green wave (2).
The subsequent pullback reinforces the possibility that this corrective phase is nearing completion, shifting attention toward another bearish extension.
The projected decline points toward the previous $3,832.33 low. A move below that level would provide stronger evidence of continued downside, although the chart does not establish a separate formal invalidation threshold.
Technical Analysis — November 16, 2026
- Trend: Bearish on M30.
- Wave Structure: Green (2) following green (1).
- Fibonacci: 78.6% corrective reference.
- Downside Reference: $3,832.33.
- Outlook: Potential renewed selling.
Trader's Question: Has the corrective rebound definitively ended?
Not yet. The retreat supports the bearish interpretation, but confirmation would strengthen if selling extends beneath the previous low rather than producing another corrective recovery.