
GOLD Forecast

GOLD Forecast

XAUUSD — New York Session Analysis | 28 Oct 2026 | H1

Compared with the 06:17 update, price tested the 61.8% retracement area and pulled back to 4044.46 by 10:19 New York time. The 4028.12 downside objective remains pending. The chart shows no breach of 4070.90, so the displayed iv/C recovery and bearish continuation scenario remain active. While price stays below the invalidation level, downside remains favored toward 4028.12, with 3989.04 and 3975.63 as lower chart targets if selling extends.
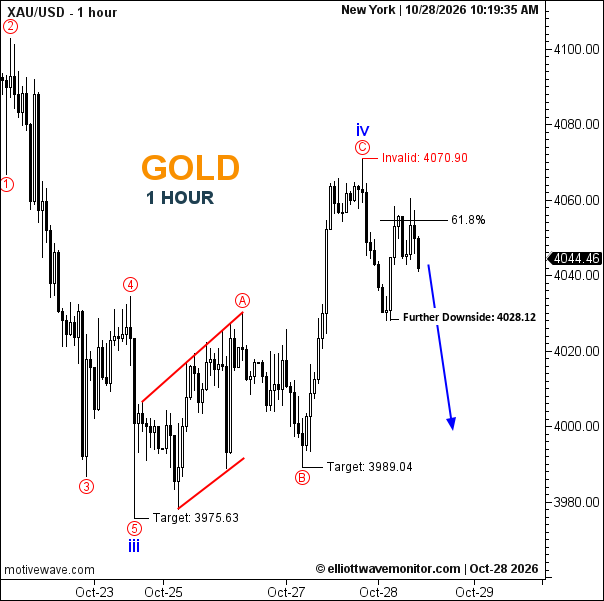
Compared with the 06:17 update, price tested the 61.8% retracement area and pulled back to 4044.46 by 10:19 New York time. The 4028.12 downside objective remains pending. The chart shows no breach of 4070.90, so the displayed iv/C recovery and bearish continuation scenario remain active. While price stays below the invalidation level, downside remains favored toward 4028.12, with 3989.04 and 3975.63 as lower chart targets if selling extends.  Summary: Trend: Bearish | Wave Structure: iv/C recovery; downside projected | Support: 4028.12 | Resistance: 61.8% retracement | Targets: 4028.12, 3989.04, 3975.63 | Invalidation: 4070.90
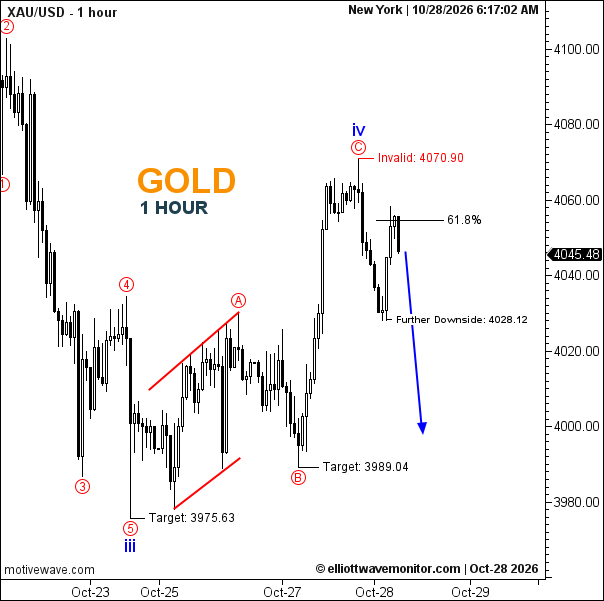
Summary: Trend: Bearish | Wave Structure: iv/C recovery; downside projected | Support: 4028.12 | Resistance: 61.8% retracement | Targets: 4028.12, 3989.04, 3975.63 | Invalidation: 4070.90

Open article page
GOLD Forecast

Gold Trend Analysis for October 28, 2026

Gold (XAU/USD) retains a bearish 1-hour outlook. The chart marks blue wave iii near 3,975.63 and blue wave iv near the rebound high. Price is 4,045.48, below the 61.8% Fibonacci level near 4,054. The blue arrow points lower, with 4,028.12 marked on the chart; further downside targets are 3,989.04 and 3,975.63. The bearish scenario remains valid below the 4,070.90 invalidation level.

Gold Trend Analysis for October 28, 2026

Technical Summary of Gold Price for October 28, 2026

  • Trend: Bearish.
  • Current Elliott Wave: Blue wave iv is marked near the rebound high; no later wave label is visible.
  • Key Support Levels: 4,028.12; 3,989.04; 3,975.63.
  • Key Resistance Levels: 61.8% area near 4,054; 4,070.90.
  • Next Price Target: 4,028.12, followed by 3,989.04 and 3,975.63.
  • Invalidation Level: 4,070.90.
  • Fibonacci Levels: 61.8% near 4,054.

Trader’s Question: Does the chart favor further downside?

The blue arrow points lower, with 4,028.12 marked on the chart. A move above 4,070.90 would invalidate the bearish scenario.

Open article page

Market guide

About GOLD Forecast

Gold, commonly represented as XAUUSD in the financial markets, is one of the most widely followed precious metals and trading instruments worldwide. XAUUSD represents the price of one troy ounce of Gold in US Dollars and is closely monitored by traders, investors, financial institutions, central banks, and market analysts.

Gold Forecast and Analysis

Our Gold Forecast provides updated market analysis focused on the potential direction of Gold against the US Dollar. Our analysis covers different timeframes and may include market trends, support and resistance levels, price structure, and potential bullish or bearish scenarios.

At Elliott Wave Monitor, we use Elliott Wave analysis together with technical analysis to study the structure of the Gold market and identify potential price movements. Each analysis is based on the latest available price action and market structure.

What Affects Gold Prices?

Gold prices are influenced by a range of economic and financial factors, including interest rates, monetary policy, inflation, the strength of the US Dollar, economic growth, financial market conditions, and global risk sentiment.

Central bank policies, particularly those of the US Federal Reserve, can have a significant impact on Gold. Changes in interest rates and expectations for future monetary policy can influence the opportunity cost of holding Gold and affect demand for the precious metal.

Gold is also widely considered a safe-haven asset. During periods of economic uncertainty, financial market stress, or geopolitical risk, demand for Gold can increase as investors seek assets that may help preserve value.

Central bank Gold purchases, investment demand, and developments in the global economy can also influence Gold prices. Because Gold is priced internationally in US Dollars, changes in the value of the US Dollar can also affect XAUUSD.

Gold Technical Analysis

Gold Technical Analysis can help traders study important price levels and market structures. Our analysis may include support and resistance levels, trend direction, Elliott Wave counts, potential reversal areas, and different market scenarios.

Technical analysis can also involve studying historical price action, chart patterns, momentum, and other technical indicators to evaluate potential changes in market direction.

As market conditions change, technical scenarios can also develop or become invalidated as new price information becomes available. For this reason, our latest Gold analysis is regularly updated on this page.

Latest Gold Forecast

This page brings together the latest Gold Forecast and XAUUSD Analysis from Elliott Wave Monitor. New analysis posts are published regularly, allowing readers to follow Gold price movements across different market conditions and timeframes.

Whether you are looking for a Gold forecast, XAUUSD forecast, Gold technical analysis, Gold price analysis, or Elliott Wave analysis, this page provides a central place to follow our latest market updates and potential price scenarios.