
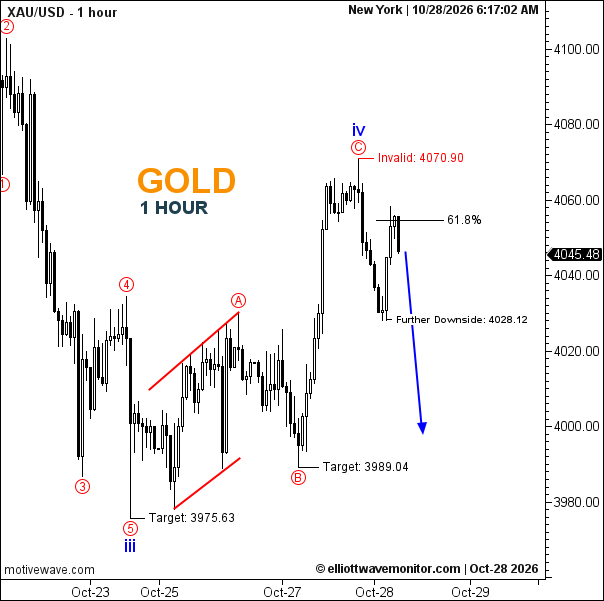
Gold (XAU/USD) retains a bearish 1-hour outlook. The chart marks blue wave iii near 3,975.63 and blue wave iv near the rebound high. Price is 4,045.48, below the 61.8% Fibonacci level near 4,054. The blue arrow points lower, with 4,028.12 marked on the chart; further downside targets are 3,989.04 and 3,975.63. The bearish scenario remains valid below the 4,070.90 invalidation level.
Technical Summary of Gold Price for October 28, 2026
- Trend: Bearish.
- Current Elliott Wave: Blue wave iv is marked near the rebound high; no later wave label is visible.
- Key Support Levels: 4,028.12; 3,989.04; 3,975.63.
- Key Resistance Levels: 61.8% area near 4,054; 4,070.90.
- Next Price Target: 4,028.12, followed by 3,989.04 and 3,975.63.
- Invalidation Level: 4,070.90.
- Fibonacci Levels: 61.8% near 4,054.
Trader’s Question: Does the chart favor further downside?
The blue arrow points lower, with 4,028.12 marked on the chart. A move above 4,070.90 would invalidate the bearish scenario.