GOLD Forecast

GOLD Forecast

Gold Forecast for October 16, 2026

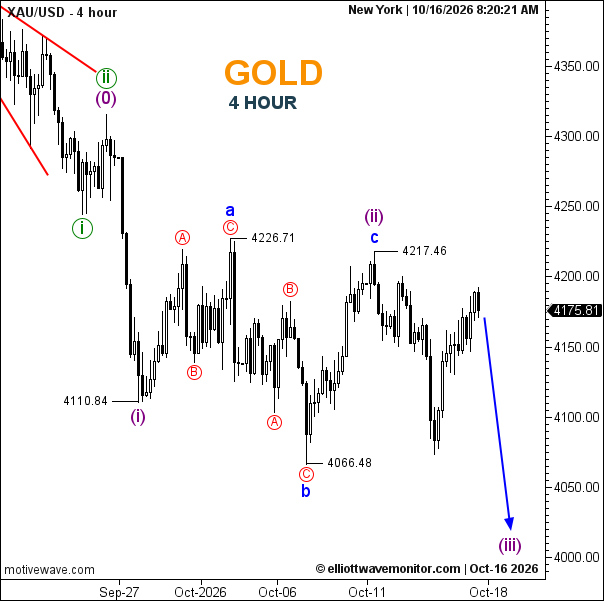
Gold is shown at 4,175.81 on the four-hour chart, below the proposed wave (ii) endpoint at 4,217.46. The a–b–c correction resembles a running flat: b reached 4,066.48, below the (i) low of 4,110.84, while c ended below a’s 4,226.71 peak. The count anticipates bearish wave (iii), with the arrow pointing toward approximately 4,020. Breaking 4,066.48 would strengthen continuation; exceeding 4,217.46 would challenge the proposed completion of (ii).
Gold Forecast for October 16, 2026

  • Trend: Bearish, with a short-term rebound.
  • Trading Range: 4,066.48–4,217.46.
  • Wave Structure: Proposed running flat in (ii); bearish (iii) anticipated.
  • Support: 4,110.84, then 4,066.48.
  • Resistance: 4,217.46, followed by 4,226.71.
Open article page
News & Analysis

Gold, Silver and Oil Forecast October 15, 2026: Inflation, Supply Risks and Elliott Wave Reversals

  • WTI oil remains exposed to supply disruptions in the Middle East, but its Elliott Wave structure suggests the latest rally may be nearing completion.
  • Silver has entered a pronounced bearish phase following its corrective rebound to $61.456, with the next projected decline targeting $53–54.

  • Gold is recovering from inflation-driven losses, yet its four-hour wave count continues to favor a potential decline toward $4,000.

Commodities News: Oil Supply Risks and US Inflation Drive Volatility

Commodity markets faced conflicting pressures on October 15 as geopolitical supply concerns supported crude oil while shifting US interest-rate expectations influenced precious metals.

Reuters reported that WTI crude declined to approximately $94.03 during early Thursday trading, reversing part of the previous session's gains. Investors were assessing threats to shipping through the Strait of Hormuz alongside discussions about easing restrictions affecting oil transportation.

The previous session's rally had been supported by escalating Middle East tensions, including attacks affecting regional energy infrastructure and shipping routes. These developments continue to introduce a substantial geopolitical risk premium into oil prices.

Gold and silver faced a different set of pressures. September's stronger-than-expected US consumer inflation figures had strengthened the dollar and Treasury yields, increasing speculation about further Federal Reserve tightening.

However, Thursday brought some relief for precious metals. Reuters reported spot gold rising above $4,150 as the dollar weakened and Treasury yields declined. Silver also recovered during the session, although its broader technical structure remained fragile.

The contrast is important: short-term recoveries driven by economic news do not necessarily confirm a sustained trend reversal. The following Elliott Wave scenarios distinguish current market prices from projected movements.

WTI Oil Elliott Wave Analysis: Corrective Wave ii Nears Completion

WTI Oil Elliott Wave Analysis: Corrective Wave ii Nears Completion

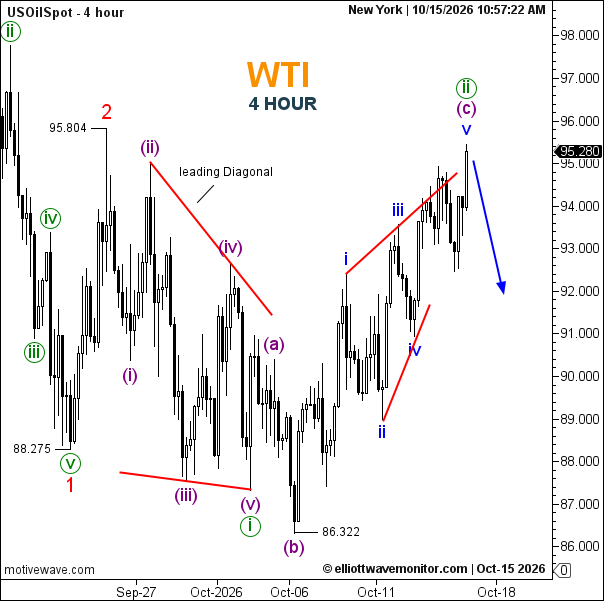
WTI trades at $95.280 on the supplied four-hour chart, dated October 15 at 10:57 a.m. New York time.

The earlier bearish sequence began after a wave 2 high at $95.804. Its first downward subdivision formed a leading diagonal, ending wave (i) near $86.322.

The subsequent recovery developed as a corrective a–b–c structure. Wave (b) reached $86.322, followed by a five-wave advance that appears to be completing wave (c) and the larger wave (ii).

The preferred scenario anticipates a bearish reversal toward approximately $92, with the possibility of further weakness if the next downward impulse becomes established.

A sustained move above $95.804 would challenge the proposed larger bearish count and require reassessment.

Silver Elliott Wave Analysis: Wave (iii) Extends Below $58.505

Silver Elliott Wave Analysis: Wave (iii) Extends Below $58.505

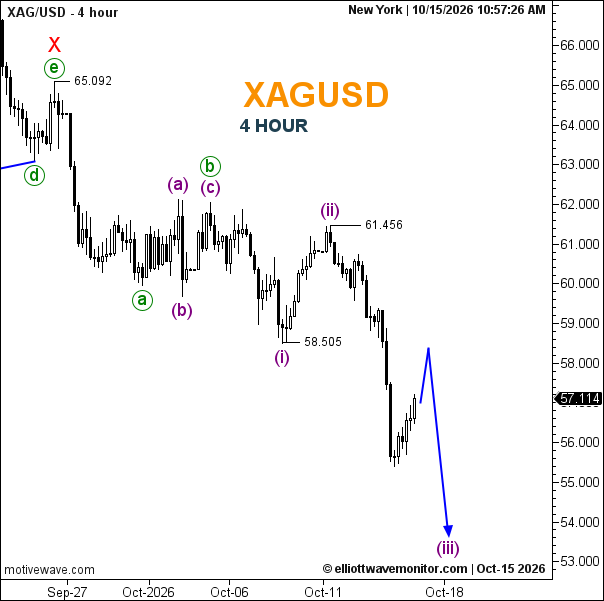
Silver trades at $57.114, reflecting substantial deterioration since its previous corrective recovery.

The earlier structure included a completed triangle near $65.092, followed by a bearish sequence. Wave (i) ended at $58.505, and wave (ii) recovered to $61.456.

The subsequent decline broke beneath $58.505, strengthening the interpretation that wave (iii) is underway.

A temporary rebound toward approximately $58–59 may occur before the next projected decline toward $53–54.

A sustained recovery above $61.456 would invalidate the current immediate wave (iii) interpretation.

Gold Elliott Wave Analysis: Bearish Wave (iii) Targets $4,000

Gold Elliott Wave Analysis: Bearish Wave (iii) Targets $4,000

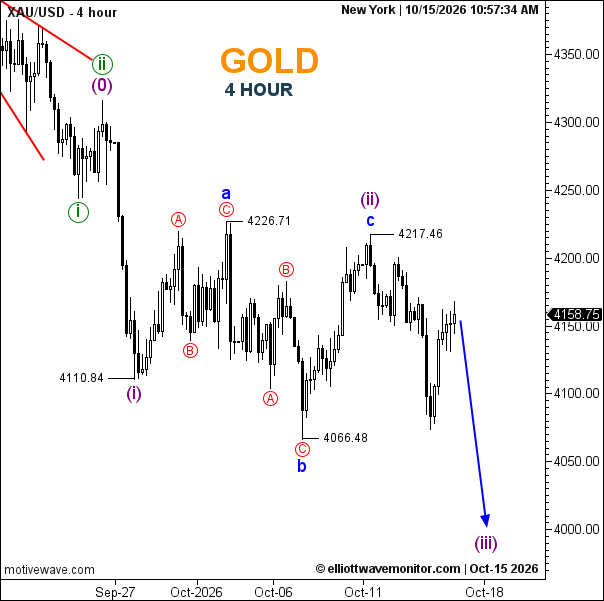
Gold's four-hour chart records $4,158.75, following a recovery from recent selling pressure.

The broader decline contains an initial wave (i) ending at $4,110.84, followed by a complex wave (ii) correction.

Within that correction, wave a reached $4,226.71, wave b declined to $4,066.48, and wave c recovered to $4,217.46.

The subsequent retreat suggests wave (iii) may have started. The projected downside path approaches $4,000, with $4,110.84 and $4,066.48 serving as intermediate reference levels.

A recovery above $4,217.46 would weaken the immediate bearish count. A sustained move beyond $4,226.71 would require broader reassessment.

Market Outlook

WTI's corrective rally appears more advanced than the bearish developments in silver and gold.

Oil traders will be watching whether the recovery can hold above previous resistance, while precious-metals investors remain focused on dollar movements, Treasury yields and Federal Reserve commentary.

For all three instruments, the projected targets remain conditional on confirmation from price action rather than economic headlines alone.

Open article page

Market guide

About GOLD Forecast

Gold, commonly represented as XAUUSD in the financial markets, is one of the most widely followed precious metals and trading instruments worldwide. XAUUSD represents the price of one troy ounce of Gold in US Dollars and is closely monitored by traders, investors, financial institutions, central banks, and market analysts.

Gold Forecast and Analysis

Our Gold Forecast provides updated market analysis focused on the potential direction of Gold against the US Dollar. Our analysis covers different timeframes and may include market trends, support and resistance levels, price structure, and potential bullish or bearish scenarios.

At Elliott Wave Monitor, we use Elliott Wave analysis together with technical analysis to study the structure of the Gold market and identify potential price movements. Each analysis is based on the latest available price action and market structure.

What Affects Gold Prices?

Gold prices are influenced by a range of economic and financial factors, including interest rates, monetary policy, inflation, the strength of the US Dollar, economic growth, financial market conditions, and global risk sentiment.

Central bank policies, particularly those of the US Federal Reserve, can have a significant impact on Gold. Changes in interest rates and expectations for future monetary policy can influence the opportunity cost of holding Gold and affect demand for the precious metal.

Gold is also widely considered a safe-haven asset. During periods of economic uncertainty, financial market stress, or geopolitical risk, demand for Gold can increase as investors seek assets that may help preserve value.

Central bank Gold purchases, investment demand, and developments in the global economy can also influence Gold prices. Because Gold is priced internationally in US Dollars, changes in the value of the US Dollar can also affect XAUUSD.

Gold Technical Analysis

Gold Technical Analysis can help traders study important price levels and market structures. Our analysis may include support and resistance levels, trend direction, Elliott Wave counts, potential reversal areas, and different market scenarios.

Technical analysis can also involve studying historical price action, chart patterns, momentum, and other technical indicators to evaluate potential changes in market direction.

As market conditions change, technical scenarios can also develop or become invalidated as new price information becomes available. For this reason, our latest Gold analysis is regularly updated on this page.

Latest Gold Forecast

This page brings together the latest Gold Forecast and XAUUSD Analysis from Elliott Wave Monitor. New analysis posts are published regularly, allowing readers to follow Gold price movements across different market conditions and timeframes.

Whether you are looking for a Gold forecast, XAUUSD forecast, Gold technical analysis, Gold price analysis, or Elliott Wave analysis, this page provides a central place to follow our latest market updates and potential price scenarios.