
Gold is shown at 4,175.81 on the four-hour chart, below the proposed wave (ii) endpoint at 4,217.46. The a–b–c correction resembles a running flat: b reached 4,066.48, below the (i) low of 4,110.84, while c ended below a’s 4,226.71 peak. The count anticipates bearish wave (iii), with the arrow pointing toward approximately 4,020. Breaking 4,066.48 would strengthen continuation; exceeding 4,217.46 would challenge the proposed completion of (ii).
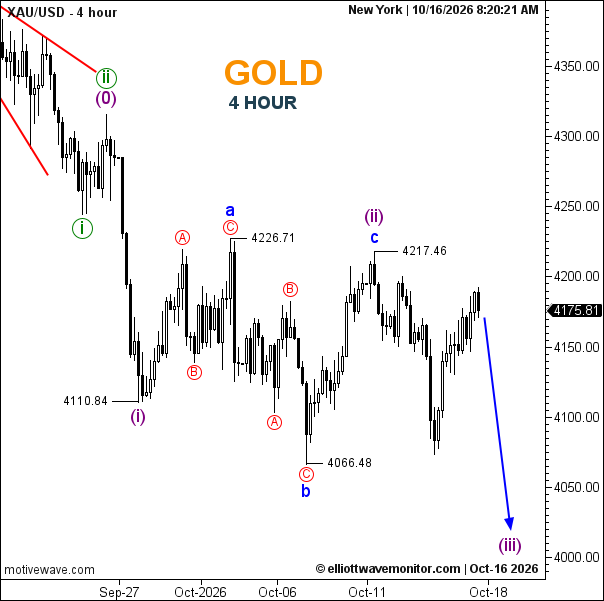
- Trend: Bearish, with a short-term rebound.
- Trading Range: 4,066.48–4,217.46.
- Wave Structure: Proposed running flat in (ii); bearish (iii) anticipated.
- Support: 4,110.84, then 4,066.48.
- Resistance: 4,217.46, followed by 4,226.71.