
Crude Oil Price stands at $92.262 on the supplied 4-hour chart. The rebound from $86.322 is approaching a critical Fibonacci resistance area, while the broader Elliott Wave structure continues to favor sellers.
WTI Elliott Wave Analysis, Fibonacci Levels and Oil News
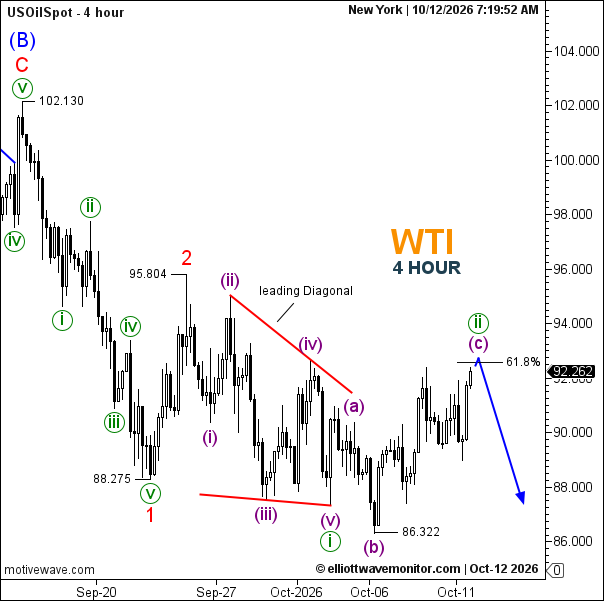
The WTI Chart identifies wave 1 ending at $88.275, followed by wave 2 at $95.804. The subsequent decline developed into a five-wave Leading Diagonal, labeled (i)–(v), completing the smaller wave i.
The current recovery represents wave ii, unfolding through an (a)–(b)–(c) corrective structure. Wave (b) bottomed at $86.322, while wave (c) is approaching the 61.8% Fibonacci resistance shown near $92.7.
A reversal from this region would support the start of wave iii, initially exposing $88.275 and $86.322. The chart projects a decline toward approximately $87–88, although these objectives remain conditional on bearish confirmation.
Immediate resistance is near $92.7, followed by $95.804. A sustained breakout above the Fibonacci zone would delay the expected decline, while a move beyond $95.804 would require reassessing the bearish count.
WTI News: Oil traders should monitor OPEC+ supply policy, US crude inventory reports, and global demand expectations. These developments could influence the timing and strength of the projected reversal. Specific current headlines and scheduled releases still require independent verification.