
ETHUSD remains bearish on the 4-hour chart, trading at the displayed price of 2,296.80. Following the completion of wave X/(c) near 2,523.20, the decline developed through blue wave i, followed by a corrective wave ii. As anticipated in our previous analysis dated October 26, 2026, bearish pressure continued, with price moving below the previously identified 2,290.40 downside reference. The chart projects a temporary rebound toward the 50.0% Fibonacci retracement near 2,350 before a renewed decline in blue wave iii toward approximately 2,200. The bearish scenario remains structurally favored below 2,523.20, while the projected rebound and subsequent decline remain unconfirmed.
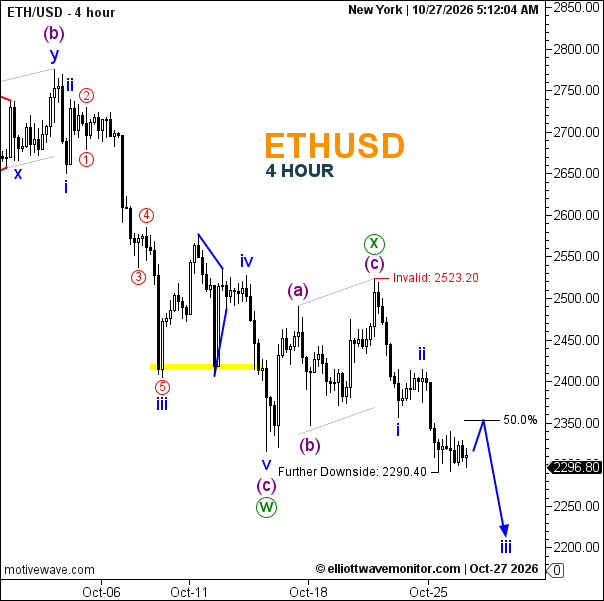
Technical Summary of Ethereum Price for October 27, 2026
-
Trend: Bearish.
-
Current Elliott Wave: Blue wave i completed; wave ii corrective rebound projected, followed by iii.
-
Key Support Levels: 2,290.40; approximately 2,200 projected.
-
Key Resistance Levels: Approximately 2,350; 2,523.20.
-
Next Price Target: Approximately 2,350 corrective rebound, then 2,200.
-
Invalidation Level: 2,523.20.
-
Fibonacci Levels: 50.0% retracement near 2,350.
Trader's Question: Will Ethereum rebound before extending its decline?
The annotated path favors a corrective recovery toward 2,350 before wave iii potentially drives price toward 2,200.