
ETHUSD Forecast

Elliott Wave analysis, market structure and the latest ETH/USD forecasts.

ETHUSD Forecast

Ethereum (ETH/USD) Forecast for October 23, 2026

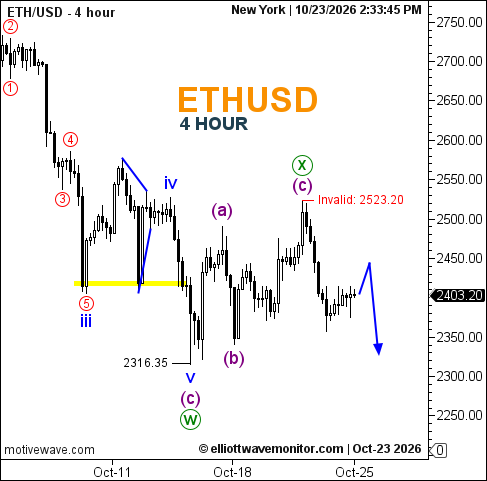
Ethereum (ETH/USD) maintains a bearish outlook on the 4-hour chart, trading near 2,403.20 after retreating from the corrective wave X peak, labeled (c), near 2,523.20. The Elliott Wave count identifies wave W completed at 2,316.35, followed by an (a)-(b)-(c) recovery forming wave X. Renewed selling pressure supports a potential downward continuation, although price remains above the previous W low. Compared with October 22, the bearish scenario remains intact, with the latest chart introducing an explicit invalidation level at 2,523.20. The blue projection suggests a temporary rebound toward approximately 2,440–2,450 before another decline toward 2,330–2,350. A sustained move above 2,523.20 would invalidate the annotated bearish setup.
Ethereum (ETH/USD) Forecast for October 23, 2026

Technical Summary of Ethereum Price for October 23, 2026

  • Trend: Bearish
  • Daily Support Levels: 2,400 (approximate); 2,316.35 (annotated historical low).
  • Daily Resistance Levels: 2,450 (projected); 2,523.20 (invalidation).
  • Elliott Wave Patterns: Completed wave W at 2,316.35; corrective (a)-(b)-(c) recovery labeled X; subsequent bearish continuation projected.
  • Projected downside zone 2,330–2,350.

Trader's Question: Has Ethereum completed wave X and begun another downward phase?

The labeled wave X peak and subsequent retreat support that interpretation, but a sustained decline below 2,316.35 would provide stronger confirmation.
Open article page
ETHUSD Forecast

ETH/USD Forecast for October 22, 2026

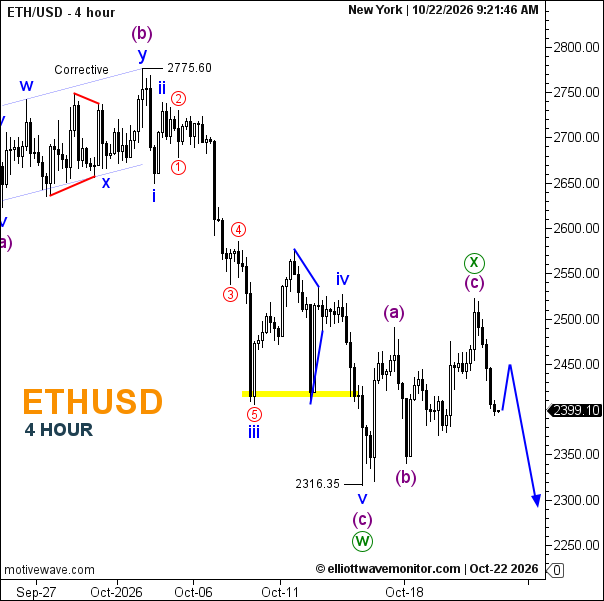
Ethereum (ETH/USD) maintains a bearish outlook on the 4-hour chart, trading near 2,399.10 after retreating from the corrective wave X peak around 2,500. The Elliott Wave structure identifies the preceding decline from 2,775.60 to 2,316.35 as wave (c), completing wave W. The subsequent (a)-(b)-(c) recovery is labeled wave X, suggesting another downward phase may develop. Recent selling pressure and the failure to sustain the rebound support this scenario. The projected blue path allows a temporary recovery toward 2,450 before renewed weakness toward 2,300. A sustained move above the X-wave high near 2,500 would challenge the immediate bearish outlook.

ETH/USD Forecast for October 22, 2026

  • Trend: Bearish

  •  

    Key Support: 2,400 (approximate); 2,316.35


  •  

    Key Resistance: 2,450; 2,500 (approximate)


  • Projected downside zone 2,300–2,316.35.

Is Ethereum beginning another downward Elliott Wave sequence?

The completed X-wave labeling and renewed selling pressure favor further weakness, although a short-term rebound remains possible before a test of 2,316.35.

Open article page

Market guide

About ETHUSD Forecast

Ethereum (ETH) is a decentralized blockchain network designed to support smart contracts and decentralized applications. The Ethereum network enables developers to build and operate applications across areas such as decentralized finance (DeFi), digital assets, gaming, governance, and other blockchain-based services. Ether (ETH) is the native cryptocurrency of the Ethereum network and is one of the most widely followed digital assets in the global financial markets.

Ethereum Forecast and Analysis

Our Ethereum Forecast provides updated market analysis focused on the potential direction of Ethereum prices. Our analysis covers different timeframes and may include market trends, support and resistance levels, price structure, and potential bullish or bearish scenarios.

At Elliott Wave Monitor, we use Elliott Wave analysis together with technical analysis to study the structure of the Ethereum market and identify potential price movements. Each analysis is based on the latest available price action and market structure.

What Affects Ethereum Prices?

Ethereum prices are influenced by a range of financial, economic, technological, and regulatory factors. Market sentiment, investor demand, liquidity, institutional participation, and broader conditions in the cryptocurrency market can all affect Ethereum's price movements.

The activity and development of the Ethereum network can also influence demand for ETH. Decentralized applications, smart contracts, decentralized finance, tokenization, and other activities on the network can contribute to demand for Ethereum's native asset.

Ethereum's transition to a Proof-of-Stake consensus mechanism also plays an important role in the network's structure. Network activity, transaction fees, ETH issuance and burning mechanisms, and staking participation can influence the supply and demand dynamics of ETH.

Regulatory developments, technological upgrades, competition from other blockchain networks, and changes in the broader digital asset market can also affect Ethereum prices.

Ethereum Technical Analysis

Ethereum Technical Analysis can help traders study important price levels and market structures. Our analysis may include support and resistance levels, trend direction, Elliott Wave counts, potential reversal areas, and different market scenarios.

As market conditions change, technical scenarios can also develop or become invalidated as new price information becomes available. For this reason, our latest Ethereum analysis is regularly updated on this page.

Latest Ethereum Forecast

This page brings together the latest Ethereum Forecast and Ethereum Analysis from Elliott Wave Monitor. New analysis posts are published regularly, allowing readers to follow Ethereum price movements across different market conditions and timeframes.

Whether you are looking for an Ethereum forecast, ETH price analysis, Ethereum technical analysis, cryptocurrency analysis, or Elliott Wave analysis, this page provides a central place to follow our latest market updates and potential price scenarios.