- The dollar’s pre-central-bank rebound keeps EUR/USD and GBP/USD under pressure, while their charts show possible corrective rebounds ahead.
- USD/JPY is retracing its fall from 158.60; the chart’s 158.604 invalidation and 156.076 downside marker define the key range.
- AUD/USD retains an upward structure with a projected dip before another advance; USD/CAD remains the clearest downside trend, toward 1.39685.
Market News
The U.S. dollar edged higher against the euro, yen and pound on Tuesday as traders positioned for policy decisions from the Federal Reserve, European Central Bank and Bank of Japan. The Reuters market snapshot showed USD/JPY at 157.73, EUR/USD at 1.1154 and sterling at $1.3324; the supplied later charts show 157.914, 1.11378 and 1.33171, respectively. The Fed, ECB and BoJ are expected to hold, so guidance and inflation risks matter as much as the decisions themselves. Elevated energy costs and French fiscal concerns are weighing on the euro, while officials in Japan have warned that intervention remains possible if yen weakness becomes disorderly.
Wednesday brings two additional catalysts for the pairs in this report. The Bank of Canada is widely expected by economists to raise its overnight rate by 25 basis points to 2.50%, although Reuters’ poll was split: 19 of 34 economists forecast a hike. That is a survey result, not a confirmed decision. Australia’s September-quarter CPI is due Wednesday at 11:30 a.m. Canberra time, before the Reserve Bank of Australia’s next decision on November 3. Sterling also faces the UK budget on Wednesday; investors will watch borrowing and fiscal signals rather than assume a specific outcome in advance.
Elliott Wave Analysis
USD/JPY
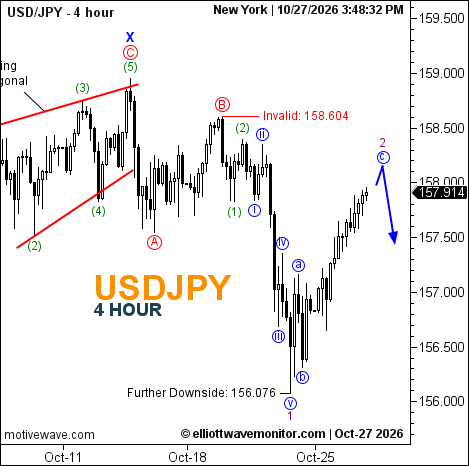
At 157.914, USD/JPY is rebounding from the chart’s 156.076 low in a smaller A-B-C recovery. The projected blue wave 2 sits near 158.2, after which the chart points lower again. The marked 158.604 invalidation is the decisive ceiling for this bearish interpretation; a sustained break above it would require a fresh count. A turn lower from the projected recovery zone, followed by a move through the recent rebound base, would strengthen the case for another test of 156.076. This is a projected correction, not a confirmed reversal.
AUD/USD
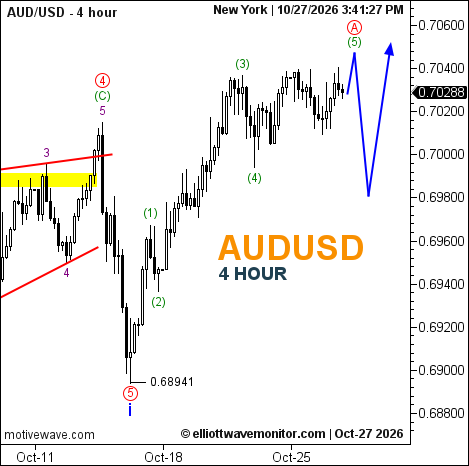
AUD/USD is 0.70288, holding near the top of its advance from 0.68941. The chart sketches a red A high around 0.705–0.706, a pullback toward roughly 0.698, then another rise toward the upper 0.705 area. Those are approximate visual zones, not formal price targets. This extends the recovery discussed in the October 21 report, when price was near 0.703 and the proposed B-wave dip toward 0.697 had not yet appeared. The current strength could mean that the A leg is still forming. A break below 0.68941 would undercut the completed-low count.
EUR/USD
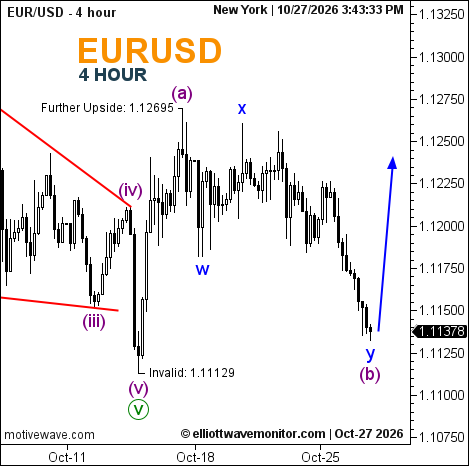
EUR/USD has fallen to 1.11378 after its recovery stalled below the chart’s 1.12695 reference. The count treats the rise as a corrective W-X-Y structure: wave (a) reached the marked high, and wave (b) is now pulling back, with a projected wave (y) rebound toward approximately 1.123–1.125. The key invalidation remains 1.11129, explicitly printed on the chart. Since October 21, price has reversed from 1.12352 and erased most of that recovery, so the bullish follow-through remains conditional on holding above 1.11129.
GBP/USD
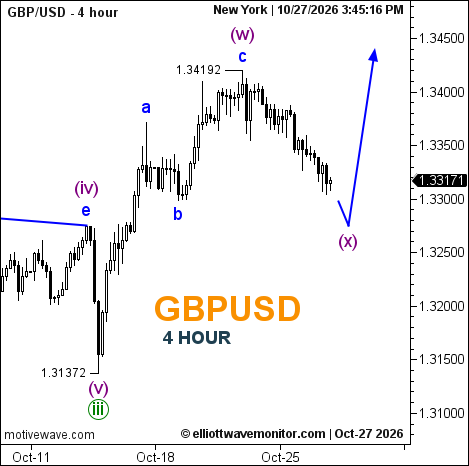
GBP/USD is 1.33171, correcting from the 1.34192 high labeled wave (w). The chart’s preferred path is a further wave (x) decline toward about 1.327, followed by a wave (y) advance toward roughly 1.344–1.345. These are chart-derived estimates; no formal invalidation level is labeled. Compared with October 21, when the pair had cleared 1.33718 and the expected deeper retracement had failed to arrive, the pullback has now developed from a higher 1.34192 peak. A break below the projected 1.327 zone would weaken the immediate rebound sequence.
USD/CAD
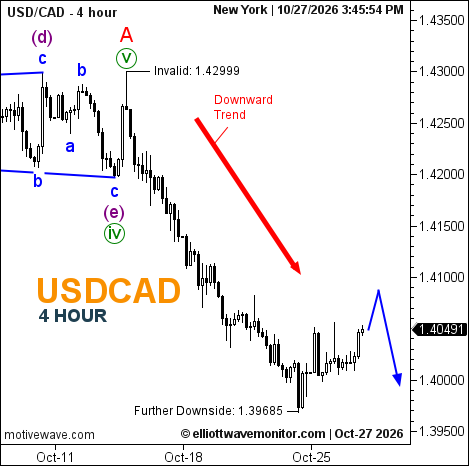
USD/CAD remains the clearest bearish chart at 1.40491. The pair has fallen sharply from wave A near 1.42999 and is attempting a modest rebound. The blue path suggests a bounce toward approximately 1.408, then another decline; the chart marks 1.39685 as further downside. Treat 1.39685 as a chart reference, not a guaranteed destination. The 1.42999 line is the displayed invalidation for the completed-A interpretation. Relative to October 21, when the pair had just turned down from 1.42999 and was near 1.40544, the broader decline has continued, although price is now attempting a short-term recovery.
Market Outlook
Central-bank decisions and Wednesday’s UK budget can disrupt otherwise orderly wave paths, while Australia’s CPI may reset rate expectations before the RBA meets next week. For USD/JPY, watch whether the projected rebound stalls below 158.604; for EUR/USD, 1.11129 is the chart’s hard invalidation. AUD/USD’s projected dip is not confirmed while price holds near its highs, and GBP/USD needs to stay above the estimated 1.327 area to preserve the immediate recovery setup. USD/CAD remains pointed lower unless the 1.42999 invalidation is reclaimed. These are Elliott Wave scenarios from the supplied four-hour charts, not trade instructions.