GBPUSD Forecast

GBPUSD Forecast

GBP/USD Forecast for October 20, 2026

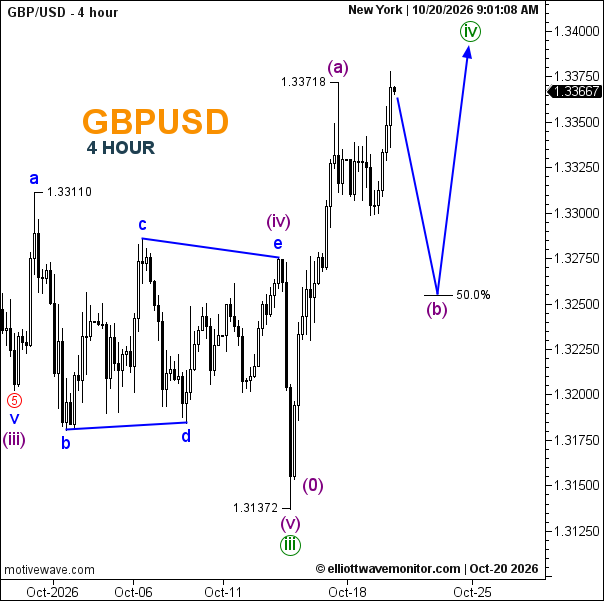
GBP/USD’s four-hour chart shows 1.33667 after rallying from 1.31372, where (v) completed the labelled wave iii. The recovery forms a developing wave iv, with (a) marked at 1.33718. Price has marginally exceeded that marker, so (a)’s endpoint remains provisional. The projected path anticipates a (b) pullback toward the marked 50.0% area near 1.3255, followed by renewed upside toward approximately 1.3390.
GBP/USD Forecast for October 20, 2026

  • Trend: Corrective rally within a broader bearish sequence.
  • Trading Range: Approximately 1.3300–1.3380.
  • Wave Structure: iii labelled complete; iv developing, with (b) still anticipated.
  • Support: 1.33110; projected pullback area near 1.3255.
  • Resistance: Around 1.3380–1.3390.

Will GBP/USD go up or down?
The chart favours a pullback before another advance. Breaking 1.31372 would invalidate the proposed start of the wave iv recovery.
Open article page
News & Analysis

Forex Outlook: Australian Dollar Reversal Emerges as Euro and Sterling Pull Back

  • AUD/USD’s revised count places wave 5 at 0.68941, replacing the previous expectation of further fifth-wave weakness.
  • EUR/USD retains its recovery scenario above 1.11129, while GBP/USD retraces after reaching 1.33718.
  • French fiscal concerns and stronger Chinese growth create different fundamental pressures across the three pairs.

Market News

Euro and Sterling: Relative Strength Matters

Reuters reported on October 19 that French unrest and fiscal concerns weighed on the euro, with the French–German bond spread widening. That backdrop creates a headwind for the chart’s projected EUR/USD recovery rather than confirming it.

Sterling reached a 17-month high against the euro but slipped against the dollar, according to Reuters. The distinction matters: strength against a troubled European currency does not establish broad pound strength. Britain’s October 28 budget remains an upcoming risk.

Australia: China Delivers a Modest Positive Surprise

China’s third-quarter GDP grew 4.5% year on year, above the 4.4% forecast and 4.3% previous reading. Reuters linked Australian-dollar gains to the stronger Chinese result. The surprise improves the external-demand backdrop, without proving that Australia’s domestic policy outlook has changed.

Elliott Wave Analysis

AUD/USD: The Fifth-Wave Decline Has a New Endpoint

AUD/USD: The Fifth-Wave Decline Has a New Endpoint

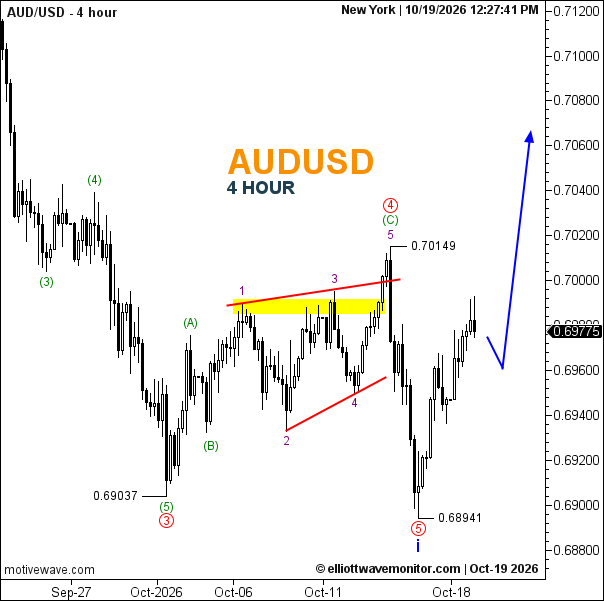
The October 19 four-hour chart, timestamped 12:27:41 New York, shows 0.69775. The revised labelling places wave 3 at 0.69037, wave 4 at 0.70149 and wave 5 at 0.68941. Wave 4 contains an A–B–C correction, with a diagonal-shaped five-part C leg.

Compared with October 16, price has broken the old 0.69037 low and rebounded. The new count treats that decline as completed rather than projecting another immediate fifth-wave extension.

The blue path allows a pullback toward approximately 0.6960 before recovery toward 0.7060–0.7070. Clearing 0.70149 would strengthen the reversal case. A break below 0.68941 invalidates the proposed completed-low scenario. The highlighted 0.6985–0.6990 area remains a nearby reference, not a confirmed breakout.

EUR/USD: A Deeper Pullback, With Invalidation Unchanged

EUR/USD: A Deeper Pullback, With Invalidation Unchanged

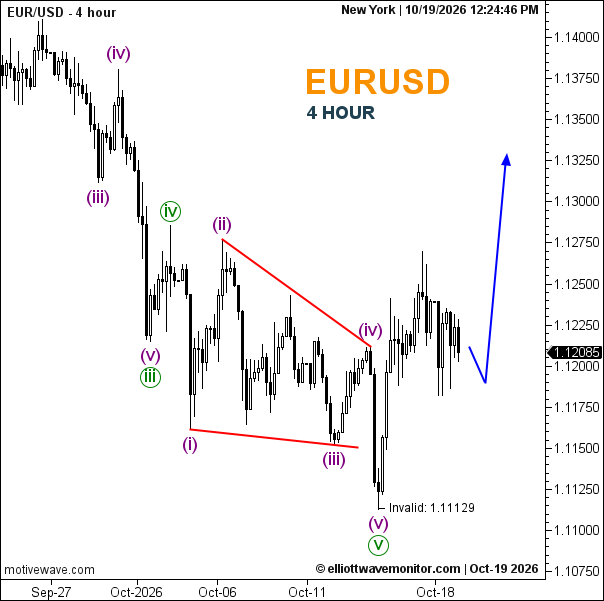
EUR/USD reads 1.12085 at 12:24:46 New York. The five-part ending diagonal remains labelled (i)–(ii)–(iii)–(iv)–(v), completing the larger wave v at the marked 1.11129 invalidation level.

Since October 16, the pair has retreated from the recovery highs rather than extended toward the earlier upside projection. The updated path permits weakness toward roughly 1.1190 before an advance toward 1.1325–1.1330.

Reclaiming approximately 1.1250–1.1270 would strengthen the recovery interpretation. Losing 1.11129 would invalidate the completed-bottom count and require renewed bearish assessment. The present pullback alone has not crossed that boundary.

GBP/USD: Recovery Peak Gives Way to a Fibonacci Test

GBP/USD: Recovery Peak Gives Way to a Fibonacci Test

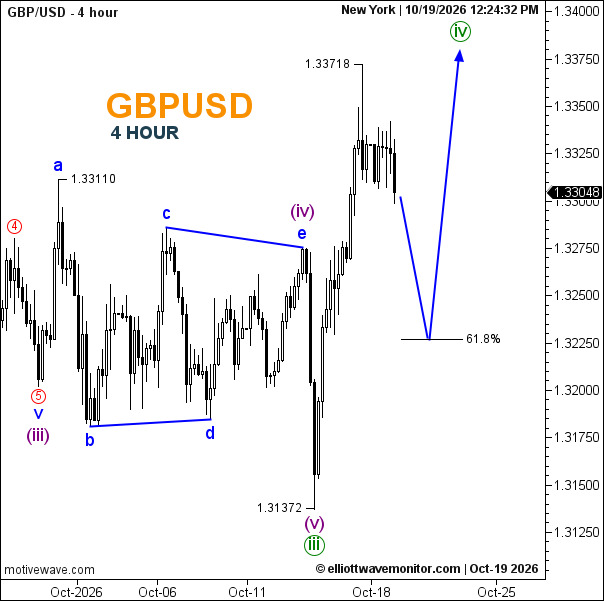
At 12:24:32 New York, GBP/USD stands at 1.33048. The earlier a–b–c–d–e triangle formed (iv), followed by (v) ending at 1.31372 and completing larger wave iii. The rebound subsequently reached 1.33718.

That advance approached, but did not reach, the October 16 target region of 1.3380–1.3390. The new projection now allows a deeper retracement toward the marked 61.8% area near 1.3227 before wave iv resumes higher.

A break above 1.33718 would support continuation toward approximately 1.3380–1.3390. Falling below 1.31372 would reject the assumption that the larger wave-iii low is complete. No detailed subdivision is supplied for the current pullback.

Market Outlook

The immediate test is whether these pullbacks preserve their respective lows and develop renewed upward momentum. Australian-dollar confirmation requires overcoming a clearly marked wave-4 peak; euro recovery must contend with French risk; sterling needs to distinguish dollar strength from its euro-cross gains. Projected support zones are decision areas, not direct trading instructions.


Open article page

Market guide

About GBPUSD Forecast

GBPUSD, also known as the British Pound to US Dollar currency pair, is one of the major pairs in the forex market. It represents the value of the British Pound against the US Dollar and is widely followed by forex traders, investors, financial institutions, and market analysts around the world.

GBPUSD Forecast and Analysis

Our GBPUSD Forecast provides updated market analysis focused on the potential direction of the British Pound against the US Dollar. Our analysis covers different timeframes and may include market trends, support and resistance levels, price structure, and potential bullish or bearish scenarios.

At Elliott Wave Monitor, we use Elliott Wave analysis together with technical analysis to study the structure of the GBPUSD market and identify potential price movements. Each analysis is based on the latest available price action and market structure.

What Affects GBPUSD?

The GBPUSD exchange rate is influenced by a range of economic and financial factors, including interest rates, monetary policy, inflation, employment, economic growth, political and economic developments, and global market conditions.

The monetary policies of the Bank of England (BoE) and the US Federal Reserve (Fed) are particularly important for GBPUSD. Changes in interest rates and expectations for future monetary policy can influence demand for the British Pound and US Dollar and affect the exchange rate.

Economic data from the United Kingdom and the United States can also have a significant impact on GBPUSD. Important indicators include inflation, GDP, employment data, consumer spending, business activity, and other measures of economic growth.

GBPUSD Technical Analysis

GBPUSD Technical Analysis can help traders study important price levels and market structures. Our analysis may include support and resistance levels, trend direction, Elliott Wave counts, potential reversal areas, and different market scenarios.

As market conditions change, technical scenarios can also develop or become invalidated as new price information becomes available. For this reason, our latest GBPUSD analysis is regularly updated on this page.

Latest GBPUSD Forecast

This page brings together the latest GBPUSD Forecast and GBPUSD Analysis from Elliott Wave Monitor. New analysis posts are published regularly, allowing readers to follow the British Pound against the US Dollar across different market conditions and timeframes.

Whether you are looking for a GBPUSD forecast, GBPUSD technical analysis, British Pound analysis, or Elliott Wave analysis, this page provides a central place to follow our latest market updates and potential trading scenarios.