
Gold (XAU/USD) maintains a bearish outlook on the 4-hour chart, with the displayed price at 4,023.11. Following the completion of the labeled corrective structure through wave (e), selling pressure intensified, forming blue waves i, ii and iii within the developing decline. In line with our previous analysis dated October 26, 2026, the bearish scenario remains intact, although the projected recovery has not yet been confirmed. The chart anticipates blue wave iv toward the 38.2% Fibonacci retracement near 4,040, followed by renewed weakness in purple wave (iii) toward approximately 3,950. The annotated downside reference at 3,975.63 remains significant, while 4,106.24 defines the bearish invalidation level.
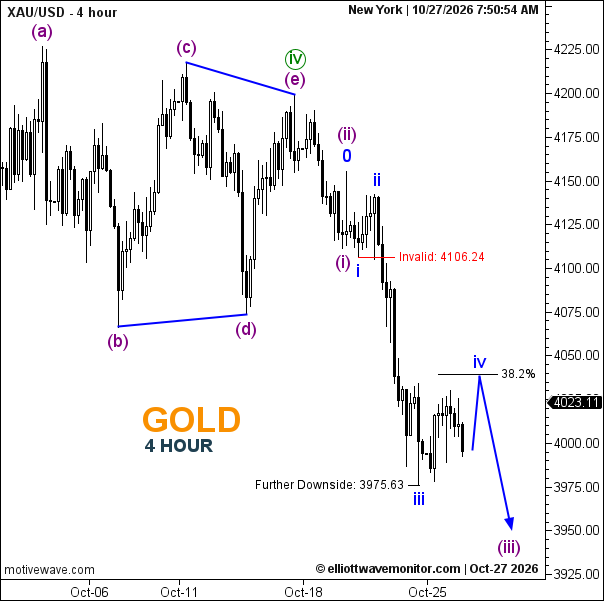
Technical Summary of Gold Price for October 27, 2026
-
Trend: Bearish.
-
Current Elliott Wave: Blue iii labeled; blue iv and purple (iii) projected.
-
Key Support Levels: 3,975.63; approximately 3,950 projected.
-
Key Resistance Levels: Approximately 4,040; 4,106.24.
-
Next Price Target: Approximately 4,040 corrective rebound, then 3,950.
-
Invalidation Level: 4,106.24.
-
Fibonacci Levels: 38.2% retracement near 4,040.
Trader's Question: Can Gold rebound toward 4,040 before extending its decline?
The annotated Elliott Wave path favors a corrective wave iv rebound before another bearish leg. A sustained move above 4,106.24 would invalidate the displayed bearish scenario.