
Gold remains bearish on the 4-hour chart, with the displayed price at 4,023.11. The Elliott Wave count shows the completed purple (a)-(b)-(c)-(d)-(e) structure at green wave iv, followed by a decline labeled purple (i)-(ii) and blue i–iii. Since October 22, the earlier bearish projection has developed into a deeper decline, with price falling below the previously annotated 4,066.48 low. The current blue wave iv rebound is projected toward the 38.2% Fibonacci retracement near 4,040, before purple wave (iii) potentially extends toward 3,950. The chart marks 3,975.63 as a further-downside reference and 4,106.24 as invalidation. A break below 3,975.63 would strengthen bearish continuation.
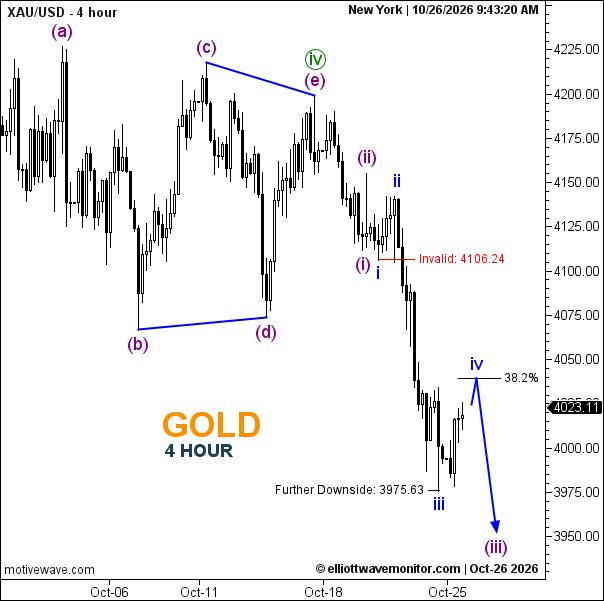
Technical Summary of Gold Price for October 26, 2026
-
Trend: Bearish.
-
Current Elliott Wave: Blue wave iii labeled; wave iv projected upward before purple (iii) completion.
-
Key Support Levels: 3,975.63 (annotated downside reference); approximately 3,950 (projected).
-
Key Resistance Levels: Approximately 4,040 (38.2% Fibonacci); 4,106.24.
-
Next Price Target: 4,040 corrective rebound, followed by 3,975.63 and potentially 3,950.
-
Invalidation Level: 4,106.24 (annotated).
-
Fibonacci Levels: 38.2% retracement near 4,040.
Trader's Question: Can gold complete wave iv before extending its decline?
A rejection near the 38.2% Fibonacci retracement would support renewed bearish pressure, particularly if price subsequently breaks below 3,975.63.