
GOLD Forecast

GOLD Forecast

Gold Forecast for October 22, 2026

Gold (XAU/USD) maintains a bearish outlook on the 4-hour chart, declining to 4,044.17 as selling pressure accelerates beneath the descending resistance line. The Elliott Wave count identifies the corrective waves a, b, and c, with wave c ending at 4,217.46 and completing the labeled wave (ii). The subsequent decline suggests wave (iii) is developing, supported by successive lower highs and a breakdown beneath the previous 4,066.48 swing low. The blue projection indicates potential continuation toward the 3,980 region, with 4,000 representing an intermediate psychological level. A recovery above 4,066.48 would ease immediate selling pressure, while a sustained move above 4,217.46 would challenge the bearish wave interpretation.
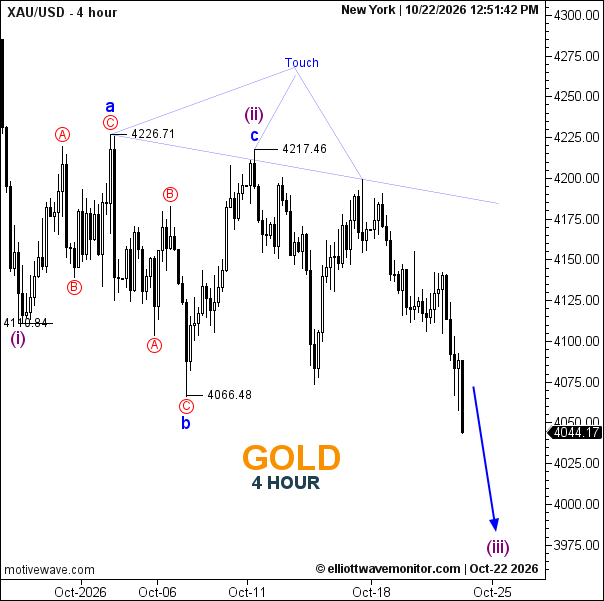
Gold Forecast for October 22, 2026

  • Trend: Bearish
  • Key Support: 4,000; 3,980 (projected)
  • Key Resistance: 4,066.48; 4,217.46
  • Projected downside zone 3,980–4,000.

Trader's Question: Has gold entered wave (iii) of its bearish Elliott Wave sequence?

The decline beneath 4,066.48 supports the developing wave (iii) scenario, although its eventual completion level remains unconfirmed.
Open article page
GOLD Forecast

Gold Forecast October 21, 2026: Elliott Wave Analysis

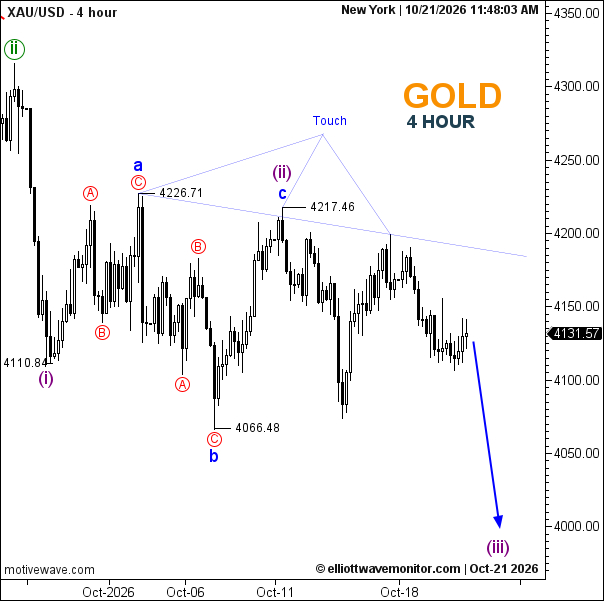
Gold is at 4,131.57, down from 4,146.93 on October 19. The chart keeps the proposed running-flat wave (ii) count: wave c peaked at 4,217.46, below wave a at 4,226.71. A downward wave (iii) is projected toward 4,000. The decline remains a scenario; a move above 4,226.71 would challenge this wave-(ii) interpretation.

Gold Forecast October 21, 2026: Elliott Wave Analysis

  • Trend: Bearish while below 4,217.46.
  • Trading Range: 4,066.48–4,217.46.
  • Wave Structure: Wave (ii) is marked complete; wave (iii) is projected lower.
  • Support: 4,110.84, then 4,066.48.
  • Resistance: 4,217.46 and 4,226.71.

Is gold going up or down? The chart favors further downside toward 4,000 while resistance holds; a break above 4,226.71 would challenge that outlook.

XAUUSD News: Gold hovered near $4,130 an ounce after touching its lowest level since October 15. Higher oil prices are reviving inflation concerns and the prospect that interest rates may stay elevated, raising the opportunity cost of holding non-yielding gold. The near-term bias therefore remains cautious to bearish while yields and rate expectations firm.

Open article page

Market guide

About GOLD Forecast

Gold, commonly represented as XAUUSD in the financial markets, is one of the most widely followed precious metals and trading instruments worldwide. XAUUSD represents the price of one troy ounce of Gold in US Dollars and is closely monitored by traders, investors, financial institutions, central banks, and market analysts.

Gold Forecast and Analysis

Our Gold Forecast provides updated market analysis focused on the potential direction of Gold against the US Dollar. Our analysis covers different timeframes and may include market trends, support and resistance levels, price structure, and potential bullish or bearish scenarios.

At Elliott Wave Monitor, we use Elliott Wave analysis together with technical analysis to study the structure of the Gold market and identify potential price movements. Each analysis is based on the latest available price action and market structure.

What Affects Gold Prices?

Gold prices are influenced by a range of economic and financial factors, including interest rates, monetary policy, inflation, the strength of the US Dollar, economic growth, financial market conditions, and global risk sentiment.

Central bank policies, particularly those of the US Federal Reserve, can have a significant impact on Gold. Changes in interest rates and expectations for future monetary policy can influence the opportunity cost of holding Gold and affect demand for the precious metal.

Gold is also widely considered a safe-haven asset. During periods of economic uncertainty, financial market stress, or geopolitical risk, demand for Gold can increase as investors seek assets that may help preserve value.

Central bank Gold purchases, investment demand, and developments in the global economy can also influence Gold prices. Because Gold is priced internationally in US Dollars, changes in the value of the US Dollar can also affect XAUUSD.

Gold Technical Analysis

Gold Technical Analysis can help traders study important price levels and market structures. Our analysis may include support and resistance levels, trend direction, Elliott Wave counts, potential reversal areas, and different market scenarios.

Technical analysis can also involve studying historical price action, chart patterns, momentum, and other technical indicators to evaluate potential changes in market direction.

As market conditions change, technical scenarios can also develop or become invalidated as new price information becomes available. For this reason, our latest Gold analysis is regularly updated on this page.

Latest Gold Forecast

This page brings together the latest Gold Forecast and XAUUSD Analysis from Elliott Wave Monitor. New analysis posts are published regularly, allowing readers to follow Gold price movements across different market conditions and timeframes.

Whether you are looking for a Gold forecast, XAUUSD forecast, Gold technical analysis, Gold price analysis, or Elliott Wave analysis, this page provides a central place to follow our latest market updates and potential price scenarios.