Nasdaq Forecast October 21, 2026: Elliott Wave Outlook
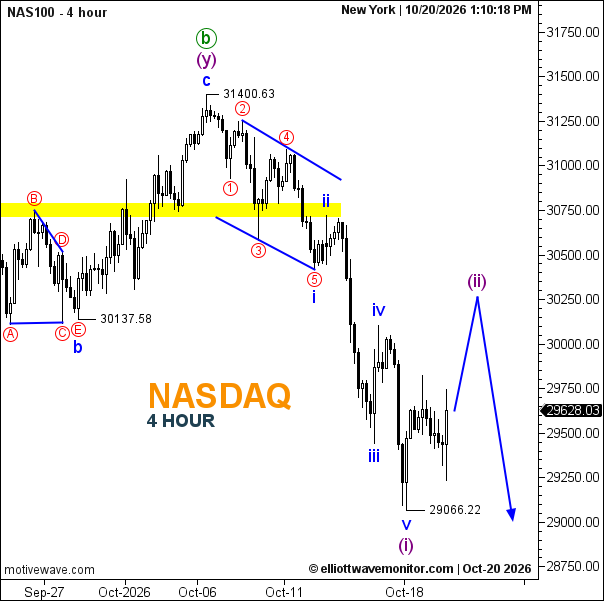
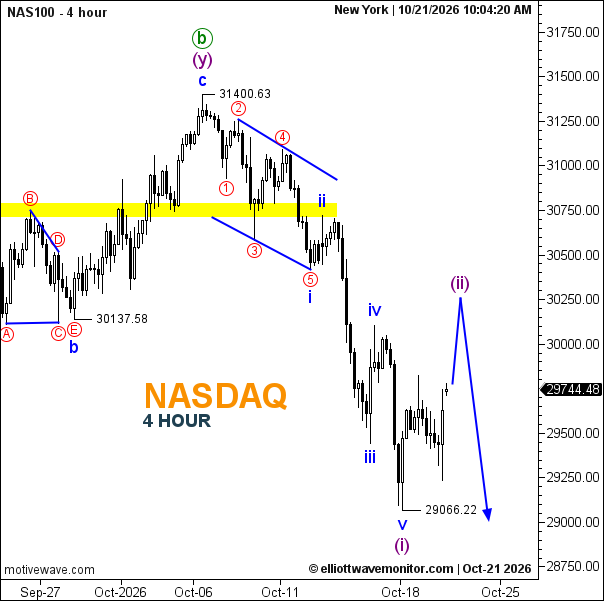
Nasdaq is at 29,744.48, up from 29,583.25 on October 19. The chart keeps 29,066.22 as the low of wave (i). The rebound may be developing as wave (ii), with a projected rise toward approximately 30,250 before another decline toward 29,000. This remains a chart scenario; 31,400.63 is the marked reference for challenging the broader bearish count.
- Trend: Bearish structure with a corrective rebound.
- Trading Range: 29,066–approximately 30,250.
- Wave Structure: Wave (i) is marked complete; wave (ii) is developing.
- Support: 29,066.22.
- Resistance: Approximately 30,000–30,250.
What is happening to Nasdaq now? It is rebounding within a potential wave (ii); a turn lower near resistance would support the projected decline.