
SILVER Forecast

News & Analysis

Gold, Silver and Oil Forecast October 13, 2026: Elliott Wave Signals Diverging Commodity Trends

  • Oil and the US dollar retreated on Tuesday as markets reassessed geopolitical supply risks ahead of critical US inflation figures.
  • Gold's four-hour Elliott Wave count suggests a possible third-wave decline toward $4,000, while WTI faces renewed downside risk toward $88.

  • Silver presents a contrasting technical outlook, with a completed corrective structure potentially supporting a recovery toward $63.

Commodity Market News: Oil Retreats as Gold and Silver Await US Inflation Data

Commodity markets experienced mixed price action on October 13 as investors reassessed Middle East supply disruptions and the Federal Reserve's interest-rate outlook.

Oil prices eased following recent gains driven by regional tensions and threats to energy infrastructure. However, continuing shipping risks and uncertainty over Russian fuel supplies kept the market sensitive to geopolitical developments.

Gold benefited modestly from a softer US dollar and declining Treasury yields. Reuters reported spot gold near $4,187 earlier Tuesday, while silver traded around $60.45.

Attention now turns to Wednesday's US Consumer Price Index, Thursday's Producer Price Index and retail sales reports, and Federal Reserve Chair Kevin Warsh's scheduled Friday appearance.

These events could influence bond yields, the dollar and commodity prices, although the technical scenarios below remain independent, conditional Elliott Wave interpretations.

WTI Crude Oil Elliott Wave Analysis: Bearish Structure Targets $88
WTI Crude Oil Elliott Wave Analysis: Bearish Structure Targets $88

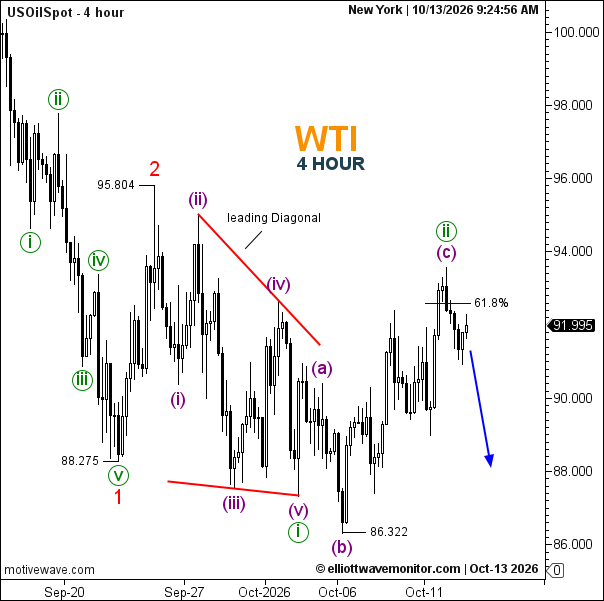
WTI's four-hour chart shows an earlier five-wave decline ending at $88.275, labeled wave 1, followed by a corrective rebound to $95.804, labeled wave 2.

The subsequent decline developed as a leading diagonal within wave (i), terminating near $86.322.

A corrective wave (ii) rebound then unfolded through waves (a), (b) and (c), reaching the 61.8% Fibonacci retracement region around $92.50–$93.00.

With USOilSpot at $91.995, the chart suggests that wave (ii) may be nearing completion, opening the possibility of a renewed bearish move.

Initial support lies around $90.00, followed by $88.275 and $86.322. The drawn projection points toward approximately $88, but a sustained break below $86.322 would be required to establish a new low beneath the previous wave (i) termination.

A sustained advance beyond the recent wave (ii) high would delay the immediate bearish scenario. A move above $95.804 would invalidate the proposed continuation from wave 2.

Silver Elliott Wave Analysis: Completed Wave (2) Could Trigger Recovery
Silver Elliott Wave Analysis: Completed Wave (2) Could Trigger Recovery

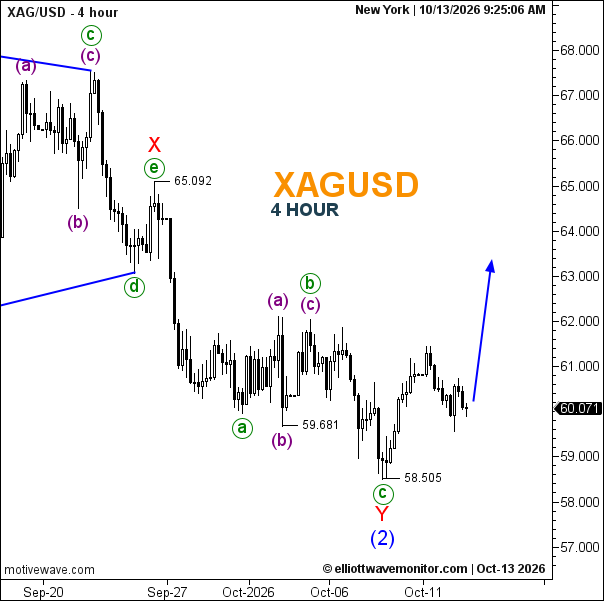
Silver's four-hour chart identifies a complex corrective decline culminating at $58.505, labeled wave (2).

The correction includes a preceding triangle ending near $65.092, followed by a W–X–Y structure whose final wave Y developed through an a–b–c decline.

The wave Y low at $58.505 may mark the completion of the broader second-wave correction.

At $60.071, silver is attempting to stabilize above that low, with the chart projecting an upward recovery toward approximately $63.

A move through $61.00–$61.50 would strengthen the bullish interpretation, followed by resistance around $62.00 and $63.00.

However, a sustained break below $58.505 would invalidate the proposed completion of wave (2) at that price and suggest the correction remains unfinished.

Gold Elliott Wave Analysis: Wave (iii) Threatens a Break Toward $4,000
Gold Elliott Wave Analysis: Wave (iii) Threatens a Break Toward $4,000

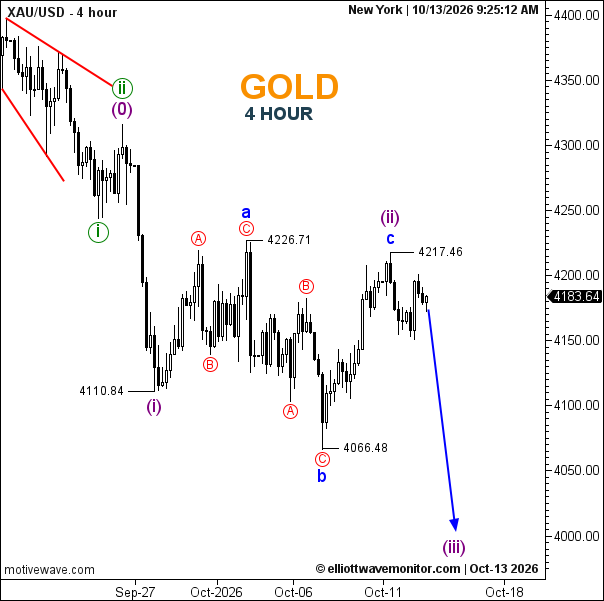
Gold's four-hour structure shows a completed bearish leading diagonal labeled wave (i), ending at $4,110.84.

Wave (ii) then developed as a corrective recovery through a–b–c, with its final c-wave high at $4,217.46. The earlier corrective high at $4,226.71 remains an additional resistance reference.

The current chart reading of $4,183.64 suggests that the market may be turning lower from wave (ii), potentially beginning a stronger bearish wave (iii).

A decline through $4,150 would strengthen the downside case, with $4,110.84 and $4,066.48 serving as subsequent support references.

The chart projects an extension toward the psychological $4,000 level, although that target is not yet confirmed by a breakdown.

A sustained recovery above $4,217.46 would weaken the immediate bearish interpretation, while a move beyond $4,226.71 would require a reassessment of the proposed wave (ii) completion.

Commodity Outlook: Three Markets, Different Elliott Wave Scenarios

WTI and gold retain bearish technical structures, but neither projected decline should be treated as confirmed until the relevant support levels break.

Silver differs: its chart suggests a potentially completed second-wave correction and the early stages of a recovery.

The upcoming US inflation releases and changes in energy-market risk premiums could accelerate or disrupt these paths. Price confirmation remains essential.
Open article page
SILVER Forecast

Silver Price Forecast for October 12, 2026

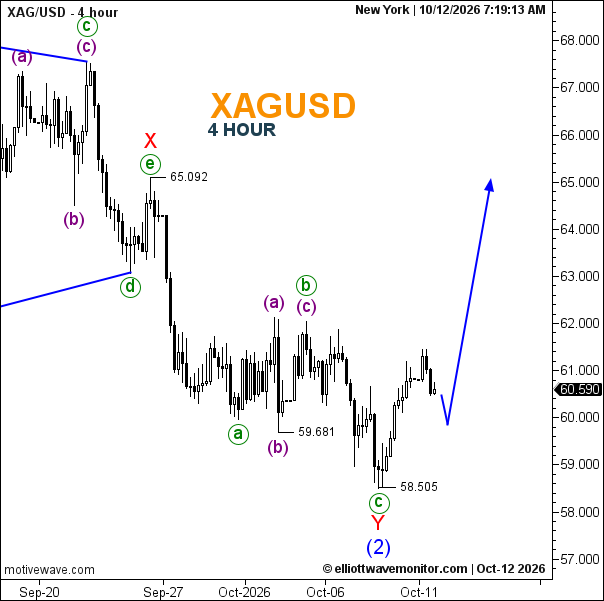
The Silver Rate stands at $60.590 on the supplied XAG/USD 4-hour chart, following a decline to $58.505 and a subsequent recovery. Buyers are attempting to stabilize prices, although the immediate rebound has yet to establish a confirmed bullish breakout.

Silver Elliott Wave Analysis, Fibonacci Levels and Silver News

Silver Elliott Wave Analysis, Fibonacci Levels and Silver News

The Silver Chart suggests a completed W–X–Y corrective structure, with wave X terminating at $65.092 and wave Y ending at $58.505. The latter is also labeled wave (2), indicating the potential completion of a larger-degree correction.

The internal wave count identifies a complex corrective sequence, with the final decline completing wave c of Y. This supports a bullish Silver Forecast, provided the $58.505 low remains intact.

The projected path allows for another short-term pullback toward the $60 region before an advance toward $65.00. Initial resistance lies around $61.50–$62.00, followed by $65.092. Support is located near $60.00 and $58.505.

A Fibonacci retracement of the $65.092–$58.505 decline places the 38.2% level at approximately $61.02, the 50% level at $61.80, and the 61.8% level at $62.58. These levels provide potential confirmation zones for a developing recovery.

A sustained move above $62.58 would strengthen the bullish outlook. Conversely, a break below $58.505 would invalidate the proposed wave (2) termination.

Silver News should focus on US inflation data, Federal Reserve policy expectations, dollar movements, and industrial-demand developments. These factors could influence whether the anticipated recovery gains momentum. The specific upcoming releases and consensus forecasts require verification before publication.

Open article page

Market guide

About SILVER Forecast

Silver is a precious metal that is widely followed in the global financial markets. It is used both as an investment asset and in a wide range of industrial applications, including electronics, solar energy, automotive technology, and manufacturing. Silver prices are generally quoted in US Dollars and are influenced by economic conditions, industrial demand, investment demand, and developments in global financial markets.

Silver Forecast and Analysis

Our Silver Forecast provides updated market analysis focused on the potential direction of Silver prices. Our analysis covers different timeframes and may include market trends, support and resistance levels, price structure, and potential bullish or bearish scenarios.

At Elliott Wave Monitor, we use Elliott Wave analysis together with technical analysis to study the structure of the Silver market and identify potential price movements. Each analysis is based on the latest available price action and market structure.

What Affects Silver Prices?

Silver prices are influenced by a range of economic, financial, and industrial factors. Industrial demand is particularly important because Silver is widely used in electronics, solar panels, automotive components, and other industrial applications.

Investment demand can also have a significant impact on Silver prices. Changes in investor sentiment, interest rates, inflation expectations, financial market conditions, and demand for precious metals can influence the price of Silver.

The US Dollar is another important factor because Silver is predominantly priced in US Dollars. Changes in the value of the US Dollar can therefore affect Silver prices and international demand for the metal.

Gold prices can also influence Silver because both metals are widely considered precious metals and are often analyzed together. The relationship between Gold and Silver can change depending on economic conditions, market sentiment, and investor demand.

XAG/USD Technical Analysis

Silver Technical Analysis can help traders study important price levels and market structures. Our analysis may include support and resistance levels, trend direction, Elliott Wave counts, potential reversal areas, and different market scenarios.

As market conditions change, technical scenarios can also develop or become invalidated as new price information becomes available. For this reason, our latest Silver analysis is regularly updated on this page.

Latest Silver Forecast

This page brings together the latest Silver Forecast and Silver Analysis from Elliott Wave Monitor. New analysis posts are published regularly, allowing readers to follow Silver price movements across different market conditions and timeframes.

Whether you are looking for a Silver forecast, Silver price analysis, Silver technical analysis, precious metals analysis, or Elliott Wave analysis, this page provides a central place to follow our latest market updates and potential price scenarios.