
- Oil and the US dollar retreated on Tuesday as markets reassessed geopolitical supply risks ahead of critical US inflation figures.
-
Gold's four-hour Elliott Wave count suggests a possible third-wave decline toward $4,000, while WTI faces renewed downside risk toward $88.
-
Silver presents a contrasting technical outlook, with a completed corrective structure potentially supporting a recovery toward $63.
Commodity Market News: Oil Retreats as Gold and Silver Await US Inflation Data
Commodity markets experienced mixed price action on October 13 as investors reassessed Middle East supply disruptions and the Federal Reserve's interest-rate outlook.
Oil prices eased following recent gains driven by regional tensions and threats to energy infrastructure. However, continuing shipping risks and uncertainty over Russian fuel supplies kept the market sensitive to geopolitical developments.
Gold benefited modestly from a softer US dollar and declining Treasury yields. Reuters reported spot gold near $4,187 earlier Tuesday, while silver traded around $60.45.
Attention now turns to Wednesday's US Consumer Price Index, Thursday's Producer Price Index and retail sales reports, and Federal Reserve Chair Kevin Warsh's scheduled Friday appearance.
These events could influence bond yields, the dollar and commodity prices, although the technical scenarios below remain independent, conditional Elliott Wave interpretations.
WTI Crude Oil Elliott Wave Analysis: Bearish Structure Targets $88
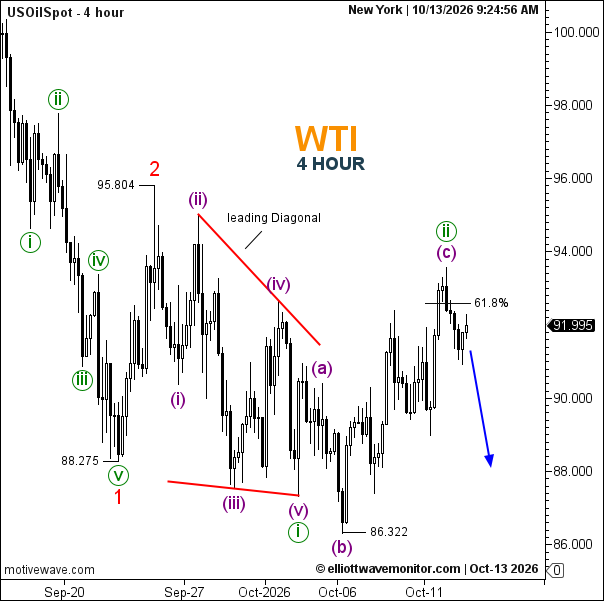
WTI's four-hour chart shows an earlier five-wave decline ending at $88.275, labeled wave 1, followed by a corrective rebound to $95.804, labeled wave 2.
The subsequent decline developed as a leading diagonal within wave (i), terminating near $86.322.
A corrective wave (ii) rebound then unfolded through waves (a), (b) and (c), reaching the 61.8% Fibonacci retracement region around $92.50–$93.00.
With USOilSpot at $91.995, the chart suggests that wave (ii) may be nearing completion, opening the possibility of a renewed bearish move.
Initial support lies around $90.00, followed by $88.275 and $86.322. The drawn projection points toward approximately $88, but a sustained break below $86.322 would be required to establish a new low beneath the previous wave (i) termination.
A sustained advance beyond the recent wave (ii) high would delay the immediate bearish scenario. A move above $95.804 would invalidate the proposed continuation from wave 2.
Silver Elliott Wave Analysis: Completed Wave (2) Could Trigger Recovery
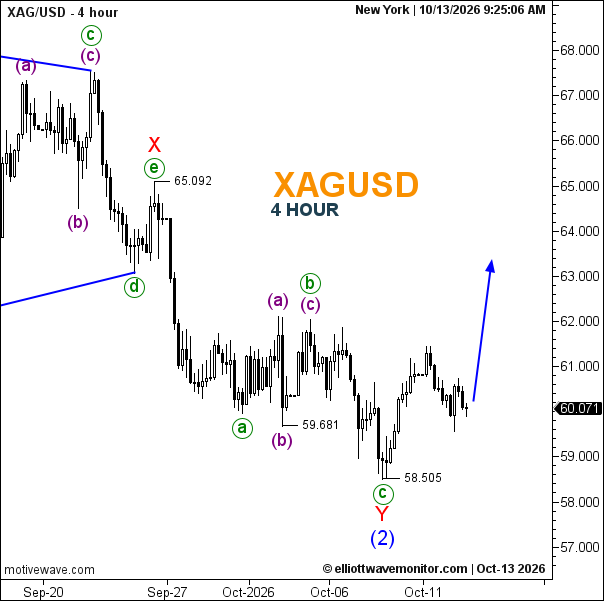
Silver's four-hour chart identifies a complex corrective decline culminating at $58.505, labeled wave (2).
The correction includes a preceding triangle ending near $65.092, followed by a W–X–Y structure whose final wave Y developed through an a–b–c decline.
The wave Y low at $58.505 may mark the completion of the broader second-wave correction.
At $60.071, silver is attempting to stabilize above that low, with the chart projecting an upward recovery toward approximately $63.
A move through $61.00–$61.50 would strengthen the bullish interpretation, followed by resistance around $62.00 and $63.00.
However, a sustained break below $58.505 would invalidate the proposed completion of wave (2) at that price and suggest the correction remains unfinished.
Gold Elliott Wave Analysis: Wave (iii) Threatens a Break Toward $4,000
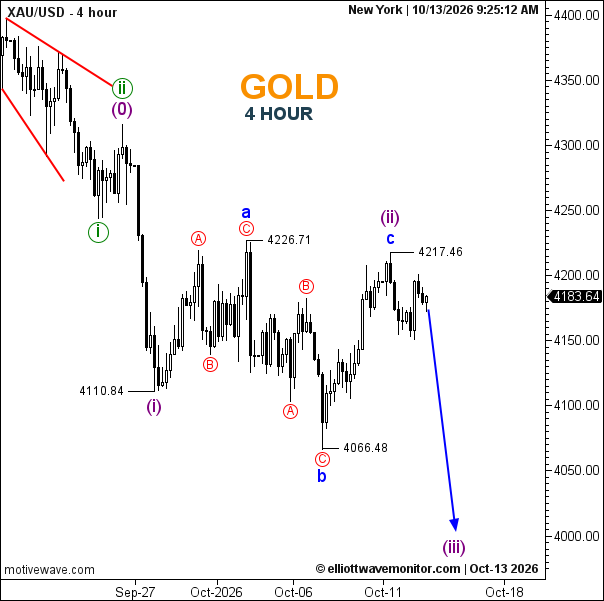
Gold's four-hour structure shows a completed bearish leading diagonal labeled wave (i), ending at $4,110.84.
Wave (ii) then developed as a corrective recovery through a–b–c, with its final c-wave high at $4,217.46. The earlier corrective high at $4,226.71 remains an additional resistance reference.
The current chart reading of $4,183.64 suggests that the market may be turning lower from wave (ii), potentially beginning a stronger bearish wave (iii).
A decline through $4,150 would strengthen the downside case, with $4,110.84 and $4,066.48 serving as subsequent support references.
The chart projects an extension toward the psychological $4,000 level, although that target is not yet confirmed by a breakdown.
A sustained recovery above $4,217.46 would weaken the immediate bearish interpretation, while a move beyond $4,226.71 would require a reassessment of the proposed wave (ii) completion.
Commodity Outlook: Three Markets, Different Elliott Wave Scenarios
WTI and gold retain bearish technical structures, but neither projected decline should be treated as confirmed until the relevant support levels break.
Silver differs: its chart suggests a potentially completed second-wave correction and the early stages of a recovery.
The upcoming US inflation releases and changes in energy-market risk premiums could accelerate or disrupt these paths. Price confirmation remains essential.