
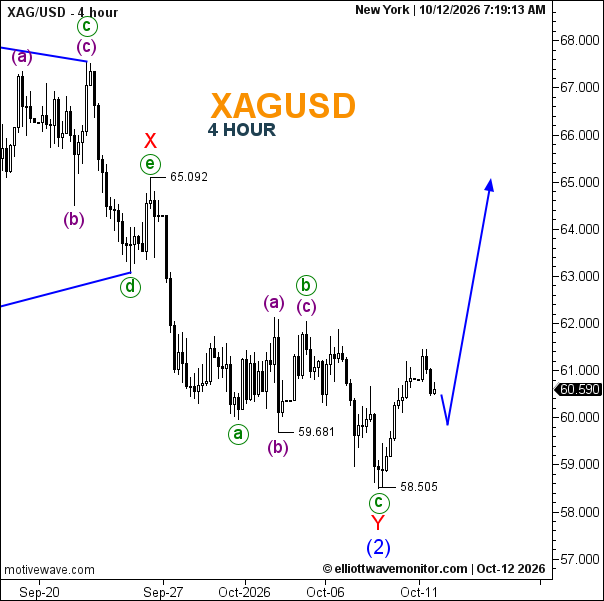
The Silver Rate stands at $60.590 on the supplied XAG/USD 4-hour chart, following a decline to $58.505 and a subsequent recovery. Buyers are attempting to stabilize prices, although the immediate rebound has yet to establish a confirmed bullish breakout.
Silver Elliott Wave Analysis, Fibonacci Levels and Silver News
The Silver Chart suggests a completed W–X–Y corrective structure, with wave X terminating at $65.092 and wave Y ending at $58.505. The latter is also labeled wave (2), indicating the potential completion of a larger-degree correction.
The internal wave count identifies a complex corrective sequence, with the final decline completing wave c of Y. This supports a bullish Silver Forecast, provided the $58.505 low remains intact.
The projected path allows for another short-term pullback toward the $60 region before an advance toward $65.00. Initial resistance lies around $61.50–$62.00, followed by $65.092. Support is located near $60.00 and $58.505.
A Fibonacci retracement of the $65.092–$58.505 decline places the 38.2% level at approximately $61.02, the 50% level at $61.80, and the 61.8% level at $62.58. These levels provide potential confirmation zones for a developing recovery.
A sustained move above $62.58 would strengthen the bullish outlook. Conversely, a break below $58.505 would invalidate the proposed wave (2) termination.
Silver News should focus on US inflation data, Federal Reserve policy expectations, dollar movements, and industrial-demand developments. These factors could influence whether the anticipated recovery gains momentum. The specific upcoming releases and consensus forecasts require verification before publication.