S&P 500 Forecast

Elliott Wave analysis, market structure and the latest S&P 500 forecasts.

S&P 500 Forecast

S&P 500 (SPX500) Forecast for October 23, 2026

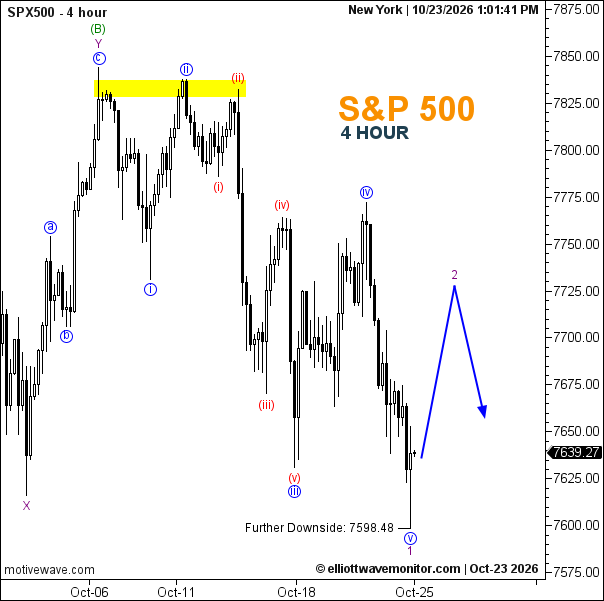
The S&P 500 has shifted to a bearish outlook on the 4-hour chart, trading near 7,639.27 following a sharp reversal from the 7,830–7,840 resistance zone. The Elliott Wave count shows a five-wave decline labeled (i)–(v), followed by a developing bearish sequence with wave 1 near the recent low and wave 2 projected as a corrective rebound. Compared with October 22, the anticipated bullish wave (v) scenario has weakened as selling pressure extended below 7,630.86. The blue projection suggests a temporary recovery toward 7,725 before renewed weakness toward 7,660. The annotated 7,598.48 level remains an important downside reference, while a sustained recovery above the highlighted resistance zone would challenge the bearish outlook.
S&P 500 (SPX500) Forecast for October 23, 2026

Technical Summary of S&P 500 Price for October 23, 2026

  • Trend: Bearish
  • Daily Support Levels: 7,630 (approximate); 7,598.48 (annotated downside reference).
  • Daily Resistance Levels: 7,725 (projected); 7,830–7,840 (highlighted resistance zone).
  • Elliott Wave Patterns: Five-wave bearish structure labeled (i)–(v), with wave 1 near the recent low and wave 2 projected as a corrective rebound before another decline.
  • Trading Range: Projected rebound zone 7,639–7,725.

Trader's Question: Has the S&P 500 invalidated its previous bullish wave scenario?

The decline below the previous 7,630.86 wave iv low weakens the bullish interpretation, while the latest chart favors a corrective rebound followed by renewed selling pressure.
Open article page
News & Analysis

AI Spending Doubts Deepen Wall Street’s Tech Selloff

U.S. shares fell as investors questioned whether heavy AI investment can deliver returns fast enough to justify expectations. The Nasdaq dropped 2.2% and the S&P 500 fell about 1.3%, with chipmakers and communication services among the weakest groups. Meta’s earnings beat failed to reassure investors, while Lam Research’s outlook added pressure to semiconductor shares. The broader message: strong results alone may no longer satisfy markets when future spending and returns remain uncertain.

Higher oil prices add an inflation risk that could keep interest rates elevated, increasing financing costs for technology companies and weighing on growth-sensitive stocks. Consumer staples outperformed, while Lockheed Martin gained after beating results, showing investors still rewarded select earnings strength.

What should traders watch next? Whether upcoming company results support AI spending plans, and whether oil-driven inflation changes rate expectations. Until then, technology and the Nasdaq face near-term pressure.

S&P 500 Forecast for October 22, 2026

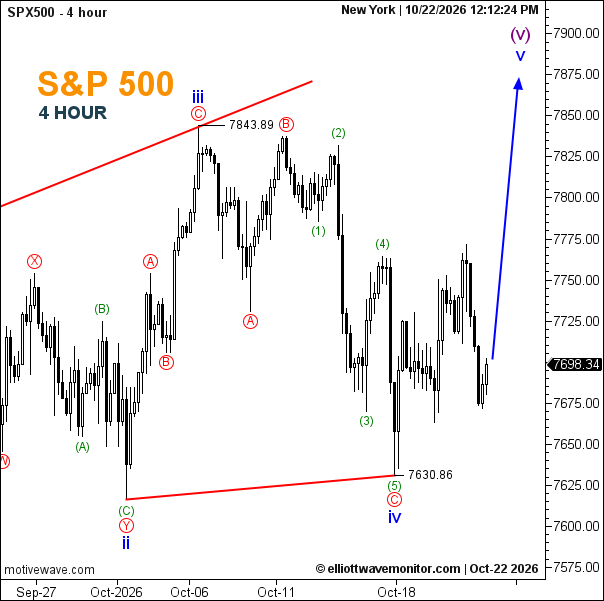
The S&P 500 maintains a cautiously bullish outlook despite recent volatility, with the chart showing 7,698.34 following a decline from 7,843.89. The Elliott Wave count identifies wave iv at 7,630.86, completing an annotated five-wave decline within wave C. The subsequent recovery suggests a potential transition toward wave (v), consistent with the upward blue projection. However, the rebound remains vulnerable while prices fluctuate below recent recovery highs near 7,760. Holding above 7,630.86 would support the bullish scenario, with 7,843.89 and the projected 7,875 region representing upside reference levels. A break beneath 7,630.86 would undermine the proposed wave iv completion.

S&P 500 Forecast for October 22, 2026

  • Trend: Bullish
  • Key Support: 7,630.86; 7,675 (approximate)
  • Key Resistance: 7,760 (approximate); 7,843.89
  • Projected upside zone 7,843.89–7,875.

Trader's Question: Has the S&P 500 completed wave iv and started wave (v)?

The labeled wave iv low at 7,630.86 supports that possibility, but stronger upward progression is needed to confirm the recovery.

NASDAQ 100 Forecast for October 22, 2026

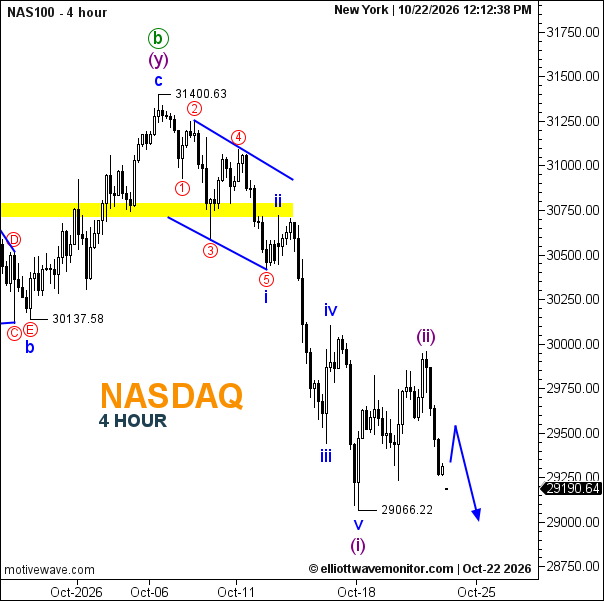
The NASDAQ 100 remains bearish on the 4-hour chart, trading around 29,190.64 after declining from 31,400.63. The Elliott Wave count identifies a five-wave decline into 29,066.22, labeled wave (i), followed by a corrective recovery labeled wave (ii). Renewed selling pressure following that rebound suggests the broader downward sequence may be resuming. The earlier breakdown below the highlighted 30,750 region reinforces the negative market structure. The blue projection allows a temporary recovery toward approximately 29,500 before another decline toward 29,000. A sustained recovery above the recent wave (ii) peak near 30,000 would weaken the immediate bearish scenario.

NASDAQ 100 Forecast for October 22, 2026

  • Trend: Bearish
  • Key Support: 29,066.22; 29,000 (approximate)
  • Key Resistance: 29,500; 30,000 (approximate)
  • Projected downside zone 29,000–29,066.22.

Trader's Question: Is the NASDAQ 100 preparing for another downward impulse?

The wave (i)-(ii) labeling and renewed weakness favor that interpretation, although confirmation requires a sustained decline beneath 29,066.22.

Dow Jones Forecast for October 22, 2026

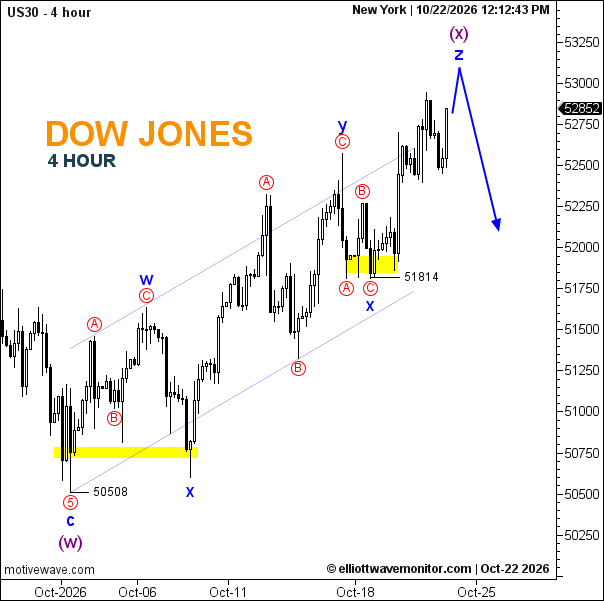
The Dow Jones retains a bullish near-term structure, with the chart showing 52,852 following an advance from the labeled 50,508 low. The Elliott Wave count identifies a developing corrective sequence, including waves W and X, with wave Z progressing toward the projected (x) completion. Price action remains supported by an ascending channel and successive higher swing lows. The blue projection suggests a final advance toward approximately 53,000–53,100 before a potential corrective decline toward the 52,000 region. The marked 51,814 support remains important to the broader structure, while a decisive break beneath it would weaken the prevailing upward configuration.

Dow Jones Forecast for October 22, 2026

  • Trend: Bullish
  • Key Support: 52,400 (approximate); 51,814
  • Key Resistance: 53,000; 53,100 (projected)
  • Projected upside zone 53,000–53,100.

Trader's Question: Could the Dow Jones reverse lower after completing wave Z?

The projected path indicates a possible reversal following another advance, but confirmation would require a clear rejection and deterioration in the current higher-low structure.

Open article page

Market guide

About S&P 500 Forecast

The S&P 500 is one of the most widely followed stock market indices in the United States and is commonly used as a broad measure of the US large-cap stock market. The index tracks 500 leading companies across a wide range of industries and is closely followed by traders, investors, financial institutions, and market analysts worldwide.

S&P 500 Forecast and Analysis

Our S&P 500 Forecast provides updated market analysis focused on the potential direction of the S&P 500 index. Our analysis covers different timeframes and may include market trends, support and resistance levels, price structure, and potential bullish or bearish scenarios.

At Elliott Wave Monitor, we use Elliott Wave analysis together with technical analysis to study the structure of the S&P 500 market and identify potential price movements. Each analysis is based on the latest available price action and market structure.

What Affects S&P 500 Prices?

The S&P 500 is influenced by a broad range of economic, financial, and corporate factors. These include interest rates, monetary policy, inflation, economic growth, employment, corporate earnings, investor sentiment, and conditions in the US and global economies.

The monetary policy of the US Federal Reserve (Fed) can have a significant impact on the S&P 500. Changes in interest rates and expectations for future monetary policy can influence borrowing costs, corporate earnings expectations, company valuations, liquidity, and investor demand for equities.

Corporate earnings are another important factor because the index represents companies from many major sectors of the US economy. Changes in consumer spending, business investment, economic activity, and expectations for future earnings can therefore affect the index.

Bond yields, the US Dollar, global financial markets, geopolitical developments, and changes in investor risk sentiment can also contribute to movements in the S&P 500.

S&P 500 Technical Analysis

S&P 500 Technical Analysis can help traders study important price levels and market structures. Our analysis may include support and resistance levels, trend direction, Elliott Wave counts, potential reversal areas, and different market scenarios.

As market conditions change, technical scenarios can also develop or become invalidated as new price information becomes available. For this reason, our latest S&P 500 analysis is regularly updated on this page.

Latest S&P 500 Forecast

This page brings together the latest S&P 500 Forecast and S&P 500 Analysis from Elliott Wave Monitor. New analysis posts are published regularly, allowing readers to follow the S&P 500 across different market conditions and timeframes.

Whether you are looking for an S&P 500 forecast, S&P 500 technical analysis, SPX analysis, US stock market analysis, or Elliott Wave analysis, this page provides a central place to follow our latest market updates and potential price scenarios.