S&P 500 Forecast

Elliott Wave analysis, market structure and the latest S&P 500 forecasts.

S&P 500 Forecast

S&P 500 Forecast October 21, 2026: Wave (v) Outlook

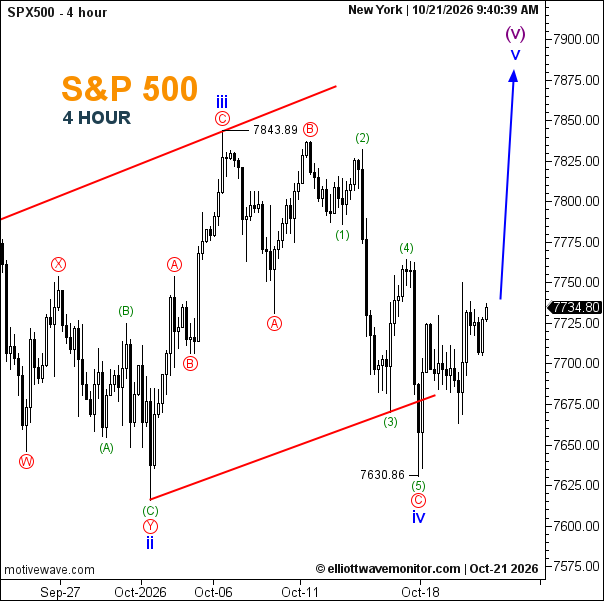
The S&P 500 is at 7,734.80, up from 7,694.36 on October 19. The chart still marks 7,630.86 as the blue-wave-(iv) low; the rebound supports a developing wave (v), projected toward approximately 7,875. That advance remains a scenario, with 7,843.89 as an overhead reference.
S&P 500 Forecast October 21, 2026: Wave (v) Outlook

  • Trend: Potential bullish wave-(v) recovery while 7,630.86 holds.
  • Trading Range: 7,630.86–approximately 7,760 near term.
  • Wave Structure: Wave (iv) is marked complete; wave (v) is developing.
  • Support: 7,630.86.
  • Resistance: Approximately 7,760, then 7,843.89.
Is the market bullish or bearish now? The chart favors a rebound while 7,630.86 holds; a break below it would challenge the wave-(v) scenario.
Open article page
News & Analysis

Wall Street Rebounds, but Elliott Wave Counts Split Across the Major Indices

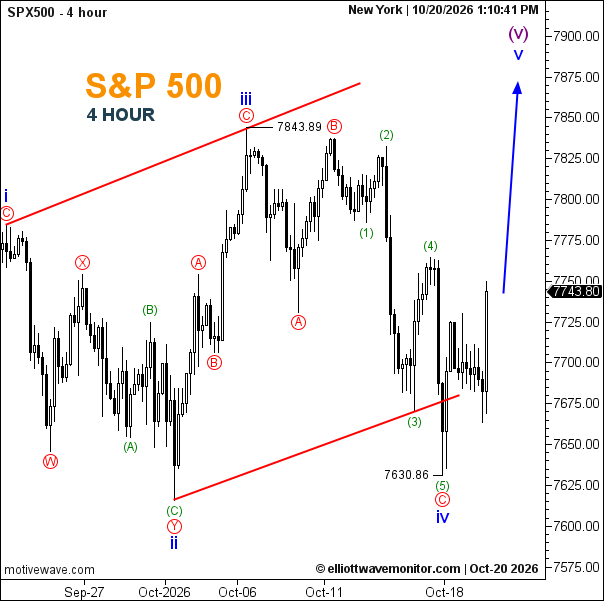
  • The S&P 500 chart favours a fifth-wave advance from 7,630.86.
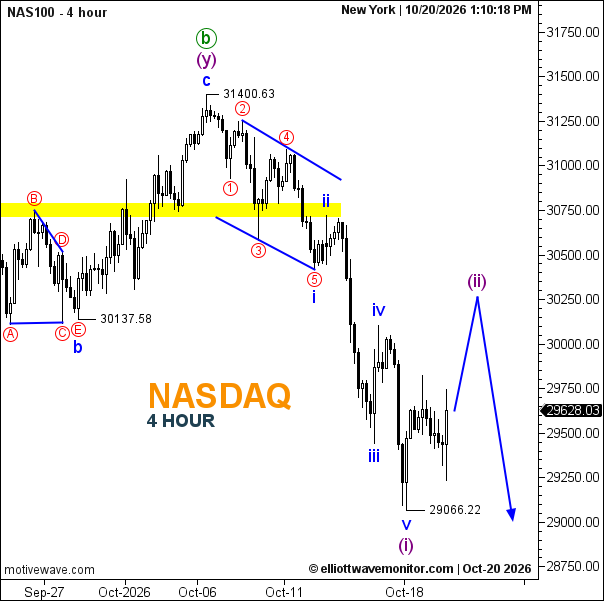
  • Nasdaq’s rebound remains labelled corrective (ii), with renewed downside projected afterward.
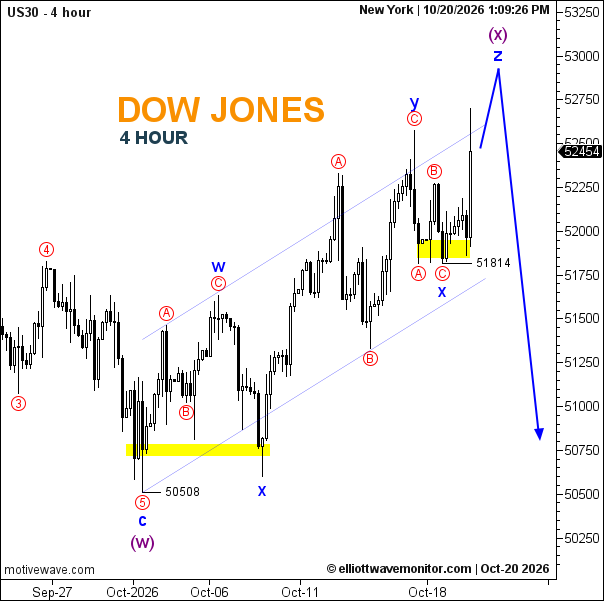
  • Dow Jones may complete a final z advance before its larger corrective rebound ends.

Market News

Healthcare Leadership Supports the Recovery

Reuters reported that healthcare reached a record high and financials gained as US stocks advanced on October 20, alongside an oil retreat.

These reports describe an ongoing session, not closing returns or the supplied chart instruments. In particular, the Nasdaq Composite is different from NAS100. Their percentage changes and price levels should not be interchanged.

AI Sentiment and the Fed Remain Unresolved

Elice fell more than 30% on its Seoul trading debut, The Wall Street Journal reported. Its weak start illustrates continuing investor sensitivity around AI financing, but cannot by itself explain every US technology-stock move.

Reuters reported that SpaceX and Netflix results were due after Tuesday’s close, with Meta and Tesla scheduled Wednesday. Separately, its October 20 economist poll favoured an October Fed hold followed by a December increase. Earnings guidance and monetary expectations therefore remain separate tests of the recovery.

Elliott Wave Analysis

S&P 500: Wave iv Low Anchors the Bullish Scenario

S&P 500: Wave iv Low Anchors the Bullish Scenario

The October 20 four-hour SPX500 chart, timestamped 13:10:41 New York, shows 7,743.80. The count places wave iii at 7,843.89, followed by an A–B–C correction ending wave iv at 7,630.86.

The final C leg contains five subdivisions, (1)–(2)–(3)–(4)–(5). Price has recovered from that low, and the arrow projects wave v toward approximately 7,865–7,875, potentially completing the larger (v).

Reclaiming the recent 7,760–7,765 area would strengthen immediate momentum. A break above 7,843.89 would support a new fifth-wave high. Losing 7,630.86 invalidates the assumption that iv is complete at that low; the larger correction would require reassessment.

Nasdaq: Recovery Is Labelled Wave (ii)

Nasdaq: Recovery Is Labelled Wave (ii)

NAS100 reads 29,628.03 at 13:10:18 New York. A five-wave i–ii–iii–iv–v decline from 31,400.63 ends at 29,066.22, completing (i). The initial i leg contains a diagonal-shaped five-part subdivision.

The rebound is projected as (ii), approaching approximately 30,250 before another decline toward 29,000 or slightly below. The arrow is a scenario, not confirmation that the next bearish wave has started.

Strength above the recent wave-iv area near 30,100–30,150 would support further recovery. A subsequent rejection and break below 29,066.22 would strengthen bearish continuation. Moving above 31,400.63 invalidates a second-wave recovery within this displayed bearish sequence.

Dow Jones: Final z Leg Could Extend the Rebound

Dow Jones: Final z Leg Could Extend the Rebound

US30 stands at 52,454 at 13:09:26 New York. After (w) ended at 50,508, the rising channel contains a w–x–y–x–z corrective combination. The latest x sits at the highlighted 51,814 support, while z is projected to complete the larger (x).

Holding 51,814 and clearing the recent 52,700–52,750 area would strengthen the final advance toward approximately 52,900–53,000. The subsequent arrow points toward roughly 50,800.

A break below 51,814 would challenge the assumption that z is already advancing and could signal an earlier downturn. The projected z endpoint is not a fixed invalidation level for the broader count; sustained strength beyond it would require reassessing the anticipated reversal.

Market Outlook

The rally does not produce a uniform technical signal. S&P 500 requires confirmation of a new high, whereas Nasdaq and Dow Jones need evidence distinguishing temporary recovery from durable trend improvement. Watch earnings reactions, oil’s effect on inflation expectations and whether the marked support levels survive renewed selling.

Open article page

Market guide

About S&P 500 Forecast

The S&P 500 is one of the most widely followed stock market indices in the United States and is commonly used as a broad measure of the US large-cap stock market. The index tracks 500 leading companies across a wide range of industries and is closely followed by traders, investors, financial institutions, and market analysts worldwide.

S&P 500 Forecast and Analysis

Our S&P 500 Forecast provides updated market analysis focused on the potential direction of the S&P 500 index. Our analysis covers different timeframes and may include market trends, support and resistance levels, price structure, and potential bullish or bearish scenarios.

At Elliott Wave Monitor, we use Elliott Wave analysis together with technical analysis to study the structure of the S&P 500 market and identify potential price movements. Each analysis is based on the latest available price action and market structure.

What Affects S&P 500 Prices?

The S&P 500 is influenced by a broad range of economic, financial, and corporate factors. These include interest rates, monetary policy, inflation, economic growth, employment, corporate earnings, investor sentiment, and conditions in the US and global economies.

The monetary policy of the US Federal Reserve (Fed) can have a significant impact on the S&P 500. Changes in interest rates and expectations for future monetary policy can influence borrowing costs, corporate earnings expectations, company valuations, liquidity, and investor demand for equities.

Corporate earnings are another important factor because the index represents companies from many major sectors of the US economy. Changes in consumer spending, business investment, economic activity, and expectations for future earnings can therefore affect the index.

Bond yields, the US Dollar, global financial markets, geopolitical developments, and changes in investor risk sentiment can also contribute to movements in the S&P 500.

S&P 500 Technical Analysis

S&P 500 Technical Analysis can help traders study important price levels and market structures. Our analysis may include support and resistance levels, trend direction, Elliott Wave counts, potential reversal areas, and different market scenarios.

As market conditions change, technical scenarios can also develop or become invalidated as new price information becomes available. For this reason, our latest S&P 500 analysis is regularly updated on this page.

Latest S&P 500 Forecast

This page brings together the latest S&P 500 Forecast and S&P 500 Analysis from Elliott Wave Monitor. New analysis posts are published regularly, allowing readers to follow the S&P 500 across different market conditions and timeframes.

Whether you are looking for an S&P 500 forecast, S&P 500 technical analysis, SPX analysis, US stock market analysis, or Elliott Wave analysis, this page provides a central place to follow our latest market updates and potential price scenarios.