
S&P 500 Forecast

Elliott Wave analysis, market structure and the latest S&P 500 forecasts.

News & Analysis

Dow Jones, Nasdaq and S&P 500 Forecast: Elliott Wave Patterns Warn of a Wall Street Reversal

  • Wall Street traded unevenly on October 13 as mixed bank earnings and weakness in semiconductor stocks challenged investor confidence.
  • The Dow Jones chart suggests that a corrective rebound may be nearing completion, with downside risk toward 50,900.

  • Nasdaq 100 and S&P 500 show different short-term patterns, but both carry the risk of renewed selling after potential corrective or final upward moves.

Wall Street News: Bank Earnings and Chip Stocks Split the Market

US equities struggled to establish a consistent direction on Tuesday as investors assessed the first major third-quarter earnings releases.

JPMorgan Chase, Goldman Sachs, Citigroup and Wells Fargo produced mixed market reactions, while semiconductor shares came under pressure amid concerns about competition from Chinese memory-chip manufacturers.

Technology weakness weighed particularly on Nasdaq, while selected financial and healthcare stocks offered support elsewhere in the market.

The latest earnings developments arrived against a backdrop of elevated borrowing costs and uncertainty surrounding Federal Reserve policy. Investors are also watching upcoming US inflation data for clues about the interest-rate outlook.

These factors could influence market volatility, but the Elliott Wave scenarios below are based on the supplied four-hour charts rather than predictions derived directly from economic headlines.

Dow Jones Elliott Wave Analysis: Corrective Rally Faces Reversal Risk
Dow Jones Elliott Wave Analysis: Corrective Rally Faces Reversal Risk

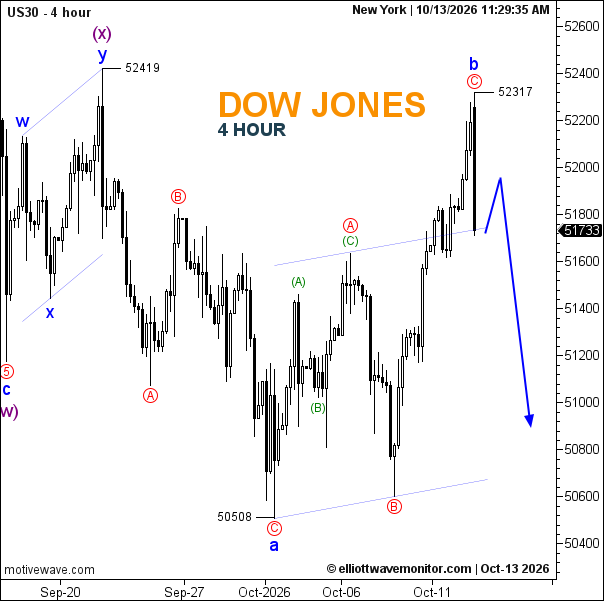
The Dow Jones four-hour chart shows a decline from 52,419 to 50,508, followed by a corrective recovery labeled a–b–c.

Wave a established the October low at 50,508, while wave b appears to have ended at 52,317 following a strong upward recovery.

At the chart reference level of 51,733, the proposed structure allows for a modest rebound toward approximately 51,900–52,000 before a stronger downward move.

The projected decline points toward 50,900, with 50,508 representing the next important downside reference if selling accelerates.

A sustained recovery above 52,317 would challenge the immediate bearish interpretation and require reassessment of the corrective wave count.

Nasdaq 100 Elliott Wave Analysis: Wave (ii) Rebound Could Precede Further Losses
Nasdaq 100 Elliott Wave Analysis: Wave (ii) Rebound Could Precede Further Losses

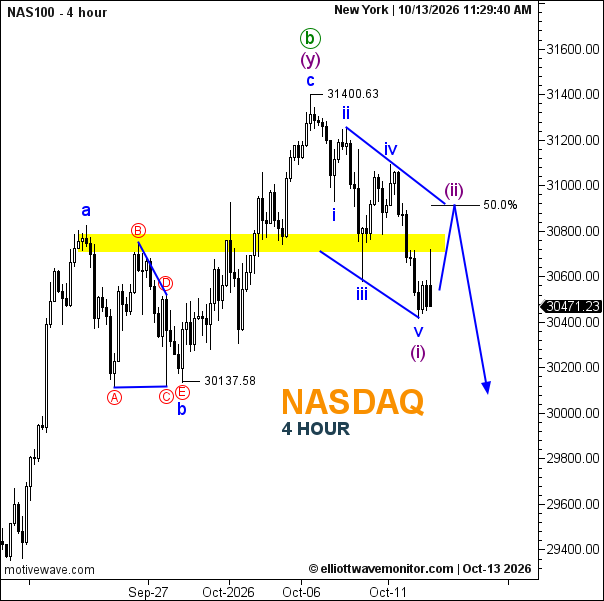
Nasdaq 100 previously reached 31,400.63, completing the upward corrective structure labeled wave (y).

A subsequent five-wave decline formed wave (i), bringing the index toward the 30,300–30,400 region.

The current chart reading of 30,471.23 suggests that a corrective wave (ii) rebound may be developing.

The 50% Fibonacci retracement near 30,900 is the principal resistance area shown on the chart. A recovery toward this zone could complete wave (ii) before a potential third-wave decline.

The projected downside path approaches 30,100, while a sustained move above 31,400.63 would invalidate the proposed bearish sequence beginning at that high.

S&P 500 Elliott Wave Analysis: Final Wave (v) Could Test 7,870
S&P 500 Elliott Wave Analysis: Final Wave (v) Could Test 7,870

The S&P 500 presents a contrasting near-term structure.

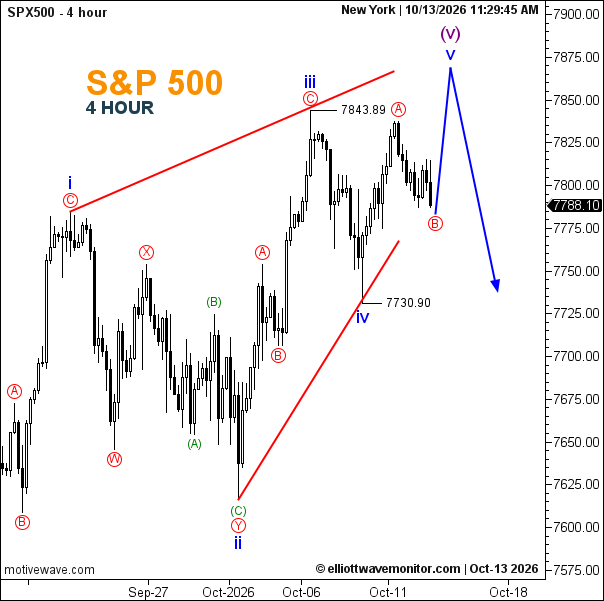
Its four-hour chart identifies an earlier wave iii high at 7,843.89, followed by a wave iv correction that reached 7,730.90.

A subsequent advance appears to have formed part of wave v, with a short corrective pullback developing near 7,788.10.

The preferred scenario anticipates one final upward extension toward approximately 7,860–7,875, potentially completing wave (v).

A reversal from that area could expose the index to a correction toward 7,740 and possibly the previous wave iv low at 7,730.90.

However, a sustained decline below the recent short-term corrective low before a new high would weaken the immediate fifth-wave extension scenario.

US Stock Market Outlook: Watch for Diverging Rebounds and Reversal Signals

The three indices do not share identical short-term wave structures.

Dow Jones may be completing a corrective rebound, Nasdaq 100 could experience a wave (ii) recovery, and S&P 500 may still require a final wave (v) high.

Despite these differences, the charts point to a common risk: renewed selling after the current or projected rebounds.

Confirmation through price structure remains essential, particularly as corporate earnings and inflation expectations continue to influence Wall Street.
Open article page
S&P 500 Forecast

S&P 500 Price Forecast for October 10, 2026

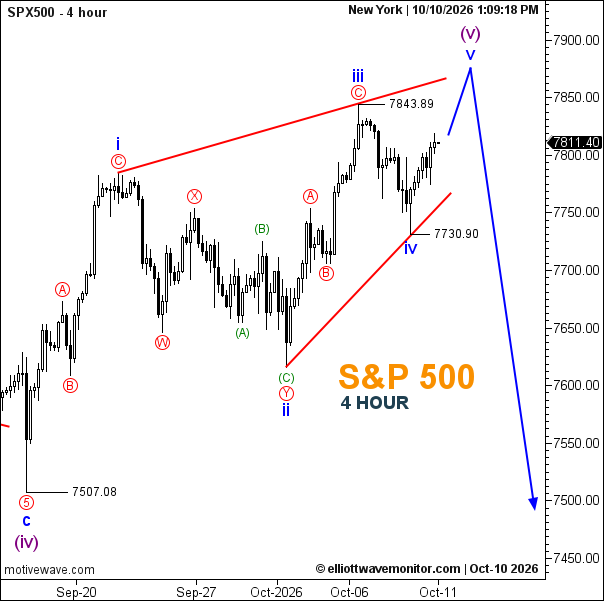
The S&P 500 is trading near 7,811 on the four-hour chart, recovering toward its recent high of 7,843.89. The index remains within an advancing wave structure, although the Elliott Wave count suggests that the current rally may be approaching a significant turning point.

S&P 500 Elliott Wave Analysis and Forecast

S&P 500 Elliott Wave Analysis and ForecastThe S&P 500 Elliott Wave chart indicates that wave (iv) ended at 7,507.08, followed by a developing five-wave advance within wave (v). The internal structure shows waves i and ii completed, while wave iii reached 7,843.89 before giving way to a corrective wave iv.

With wave iv marked near 7,730.90, the preferred scenario anticipates a final advance in wave v toward the 7,850–7,900 region, potentially completing the larger wave (v).

A sustained break above 7,843.89 would strengthen the case for this final upward leg. However, the projected completion of wave (v) could mark the end of the broader bullish sequence and precede a substantial corrective decline.

Failure to establish a new high, particularly if followed by a break below 7,730.90, would weaken the immediate bullish outlook and raise the possibility that the anticipated reversal has already begun.

Open article page

Market guide

About S&P 500 Forecast

The S&P 500 is one of the most widely followed stock market indices in the United States and is commonly used as a broad measure of the US large-cap stock market. The index tracks 500 leading companies across a wide range of industries and is closely followed by traders, investors, financial institutions, and market analysts worldwide.

S&P 500 Forecast and Analysis

Our S&P 500 Forecast provides updated market analysis focused on the potential direction of the S&P 500 index. Our analysis covers different timeframes and may include market trends, support and resistance levels, price structure, and potential bullish or bearish scenarios.

At Elliott Wave Monitor, we use Elliott Wave analysis together with technical analysis to study the structure of the S&P 500 market and identify potential price movements. Each analysis is based on the latest available price action and market structure.

What Affects S&P 500 Prices?

The S&P 500 is influenced by a broad range of economic, financial, and corporate factors. These include interest rates, monetary policy, inflation, economic growth, employment, corporate earnings, investor sentiment, and conditions in the US and global economies.

The monetary policy of the US Federal Reserve (Fed) can have a significant impact on the S&P 500. Changes in interest rates and expectations for future monetary policy can influence borrowing costs, corporate earnings expectations, company valuations, liquidity, and investor demand for equities.

Corporate earnings are another important factor because the index represents companies from many major sectors of the US economy. Changes in consumer spending, business investment, economic activity, and expectations for future earnings can therefore affect the index.

Bond yields, the US Dollar, global financial markets, geopolitical developments, and changes in investor risk sentiment can also contribute to movements in the S&P 500.

S&P 500 Technical Analysis

S&P 500 Technical Analysis can help traders study important price levels and market structures. Our analysis may include support and resistance levels, trend direction, Elliott Wave counts, potential reversal areas, and different market scenarios.

As market conditions change, technical scenarios can also develop or become invalidated as new price information becomes available. For this reason, our latest S&P 500 analysis is regularly updated on this page.

Latest S&P 500 Forecast

This page brings together the latest S&P 500 Forecast and S&P 500 Analysis from Elliott Wave Monitor. New analysis posts are published regularly, allowing readers to follow the S&P 500 across different market conditions and timeframes.

Whether you are looking for an S&P 500 forecast, S&P 500 technical analysis, SPX analysis, US stock market analysis, or Elliott Wave analysis, this page provides a central place to follow our latest market updates and potential price scenarios.