
- Wall Street traded unevenly on October 13 as mixed bank earnings and weakness in semiconductor stocks challenged investor confidence.
-
The Dow Jones chart suggests that a corrective rebound may be nearing completion, with downside risk toward 50,900.
-
Nasdaq 100 and S&P 500 show different short-term patterns, but both carry the risk of renewed selling after potential corrective or final upward moves.
Wall Street News: Bank Earnings and Chip Stocks Split the Market
US equities struggled to establish a consistent direction on Tuesday as investors assessed the first major third-quarter earnings releases.
JPMorgan Chase, Goldman Sachs, Citigroup and Wells Fargo produced mixed market reactions, while semiconductor shares came under pressure amid concerns about competition from Chinese memory-chip manufacturers.
Technology weakness weighed particularly on Nasdaq, while selected financial and healthcare stocks offered support elsewhere in the market.
The latest earnings developments arrived against a backdrop of elevated borrowing costs and uncertainty surrounding Federal Reserve policy. Investors are also watching upcoming US inflation data for clues about the interest-rate outlook.
These factors could influence market volatility, but the Elliott Wave scenarios below are based on the supplied four-hour charts rather than predictions derived directly from economic headlines.
Dow Jones Elliott Wave Analysis: Corrective Rally Faces Reversal Risk
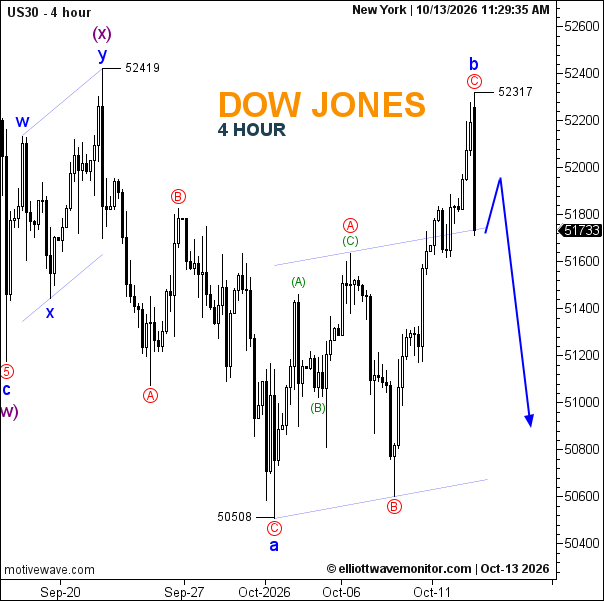
The Dow Jones four-hour chart shows a decline from 52,419 to 50,508, followed by a corrective recovery labeled a–b–c.
Wave a established the October low at 50,508, while wave b appears to have ended at 52,317 following a strong upward recovery.
At the chart reference level of 51,733, the proposed structure allows for a modest rebound toward approximately 51,900–52,000 before a stronger downward move.
The projected decline points toward 50,900, with 50,508 representing the next important downside reference if selling accelerates.
A sustained recovery above 52,317 would challenge the immediate bearish interpretation and require reassessment of the corrective wave count.
Nasdaq 100 Elliott Wave Analysis: Wave (ii) Rebound Could Precede Further Losses
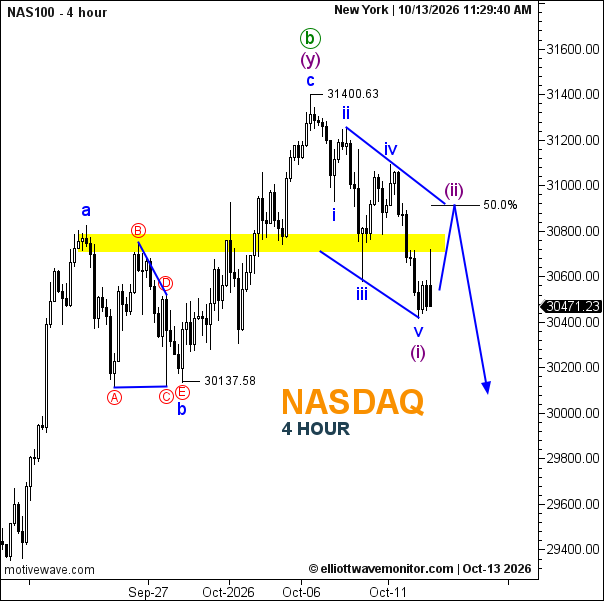
Nasdaq 100 previously reached 31,400.63, completing the upward corrective structure labeled wave (y).
A subsequent five-wave decline formed wave (i), bringing the index toward the 30,300–30,400 region.
The current chart reading of 30,471.23 suggests that a corrective wave (ii) rebound may be developing.
The 50% Fibonacci retracement near 30,900 is the principal resistance area shown on the chart. A recovery toward this zone could complete wave (ii) before a potential third-wave decline.
The projected downside path approaches 30,100, while a sustained move above 31,400.63 would invalidate the proposed bearish sequence beginning at that high.
S&P 500 Elliott Wave Analysis: Final Wave (v) Could Test 7,870
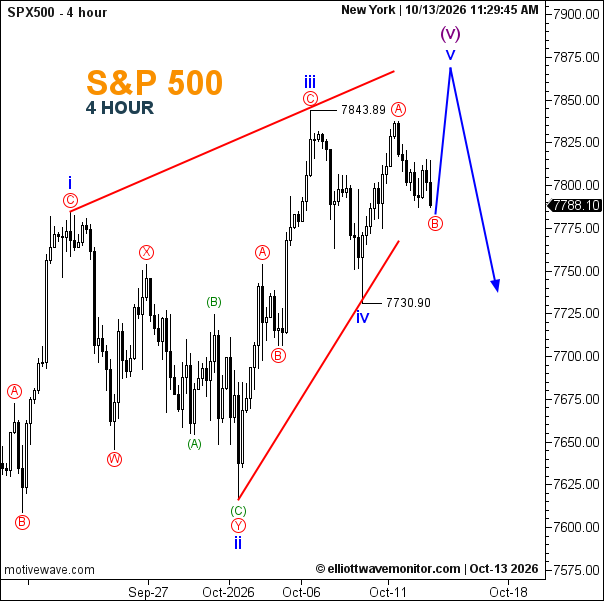
The S&P 500 presents a contrasting near-term structure.
Its four-hour chart identifies an earlier wave iii high at 7,843.89, followed by a wave iv correction that reached 7,730.90.
A subsequent advance appears to have formed part of wave v, with a short corrective pullback developing near 7,788.10.
The preferred scenario anticipates one final upward extension toward approximately 7,860–7,875, potentially completing wave (v).
A reversal from that area could expose the index to a correction toward 7,740 and possibly the previous wave iv low at 7,730.90.
However, a sustained decline below the recent short-term corrective low before a new high would weaken the immediate fifth-wave extension scenario.
US Stock Market Outlook: Watch for Diverging Rebounds and Reversal Signals
The three indices do not share identical short-term wave structures.
Dow Jones may be completing a corrective rebound, Nasdaq 100 could experience a wave (ii) recovery, and S&P 500 may still require a final wave (v) high.
Despite these differences, the charts point to a common risk: renewed selling after the current or projected rebounds.
Confirmation through price structure remains essential, particularly as corporate earnings and inflation expectations continue to influence Wall Street.