
WTI crude oil maintains a bearish near-term outlook on the 4-hour chart, despite the preceding upward structure, with the displayed price at 100.360. The user-labeled Elliott Wave count identifies blue wave b and red C near the recent high, following the completion of purple wave (i). Consistent with our previous analysis dated October 26, 2026, the projected correction remains valid, although the anticipated decline has not yet been confirmed. The blue path anticipates wave c falling toward approximately 94.00 to complete purple wave (ii), followed by a potential recovery toward 102.00. The chart marks 95.052 as an intermediate downside reference and 103.276 as the invalidation level. Sustained strength above the recent high would challenge the corrective scenario.
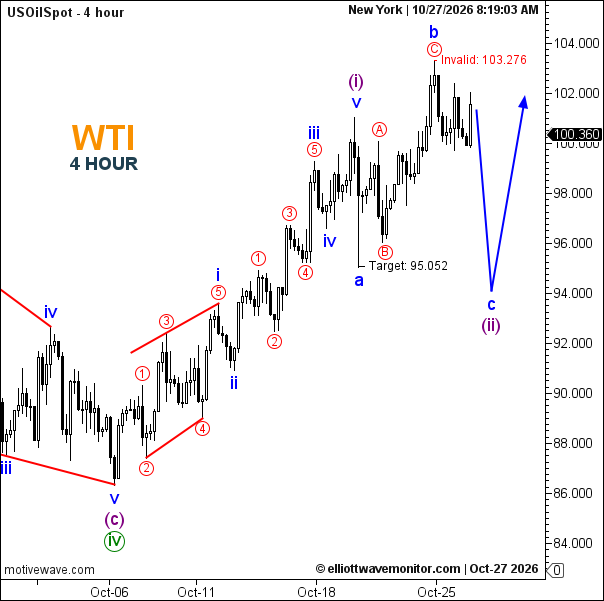
Technical Summary of WTI Oil Price for October 27, 2026
-
Trend: Bearish (near-term correction).
-
Current Elliott Wave: Blue b labeled; blue c and purple (ii) projected.
-
Key Support Levels: 95.052; approximately 94.00 projected.
-
Key Resistance Levels: Approximately 102.00; 103.276.
-
Next Price Target: 95.052, followed by approximately 94.00.
-
Invalidation Level: 103.276.
Trader's Question: Will WTI complete wave (ii) before recovering?
The projected path favors a decline toward 94.00 before a possible rebound toward 102.00. A sustained break above 103.276 would invalidate the annotated corrective scenario.