
Bitcoin maintains a bearish 4-hour outlook, with the chart displaying 81,425.35. Following wave X/(c) near 84,850, the decline developed through the labeled purple (a)–(b) structure and blue wave i. The red W-X-Y rebound is approaching the 61.8% Fibonacci retracement near 81,000, with blue wave ii marked above the corrective structure. Compared with our analysis dated October 27, 2026, the displayed price has risen from 81,326.50, while the bearish projection remains unchanged. The annotated path favors a subsequent blue wave iii decline toward approximately 77,700, with 79,253.95 as the intermediate downside reference. The scenario's marked invalidation remains 81,961.65.
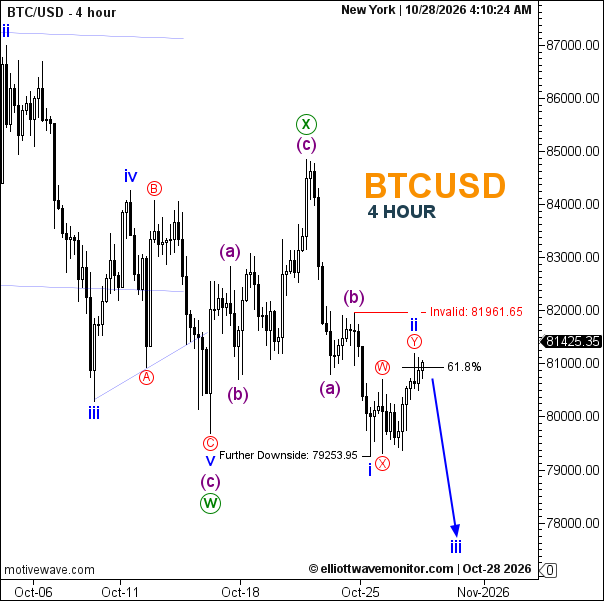
Technical Summary of Bitcoin Price for October 28, 2026
-
Trend: Bearish.
-
Current Elliott Wave: Red W-X-Y correction; blue ii labeled, iii projected.
-
Key Support Levels: 79,253.95; approximately 77,700 projected.
-
Key Resistance Levels: Approximately 81,000; 81,961.65.
-
Next Price Target: 79,253.95, then approximately 77,700.
-
Invalidation Level: 81,961.65.
-
Fibonacci Levels: 61.8% near 81,000.
Trader's Question: Will Bitcoin complete wave ii before a bearish wave iii?
The projected path favors renewed weakness below 81,961.65, but the anticipated wave iii decline remains unconfirmed.