
BTCUSD maintains a bearish outlook on the 4-hour chart, with the displayed price at 79,546.90. Following the corrective wave X/(c) peak at 84,849.70, the market continues to develop a downward structure, preserving the Elliott Wave sequence W-X and the subsequent purple (a)-(b) correction. In line with our previous analysis dated October 26, 2026, bearish pressure has persisted, bringing Bitcoin closer to the annotated downside objective at 79,253.95. A sustained breakdown below this level would support an extension toward approximately 78,500, as illustrated by the blue projection. Meanwhile, the 50.0% Fibonacci retracement near 80,600 represents potential corrective resistance. The broader bearish scenario remains valid below the annotated invalidation level at 84,849.70.
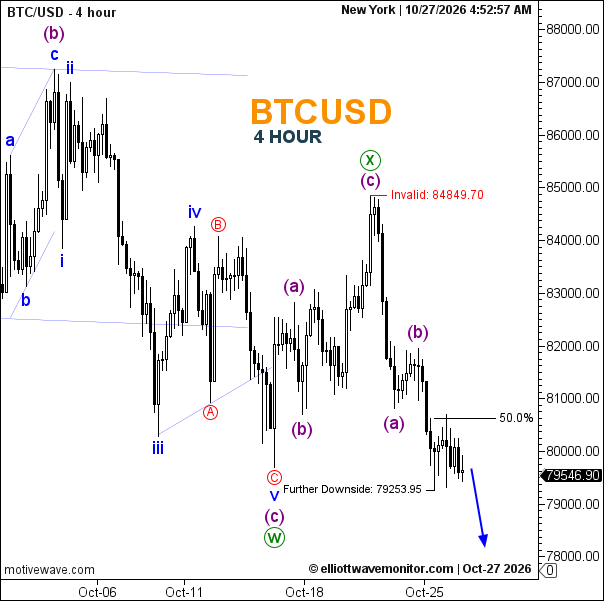
Technical Summary of Bitcoin Price for October 27, 2026
-
Trend: Bearish.
-
Current Elliott Wave: Bearish development following wave X, with purple (a)-(b) labeled.
-
Key Support Levels: 79,253.95; approximately 78,500 (projected).
-
Key Resistance Levels: Approximately 80,600 (Fibonacci resistance); 84,849.70.
-
Next Price Target: 79,253.95, followed by approximately 78,500.
-
Invalidation Level: 84,849.70.
-
Fibonacci Levels: 50.0% retracement near 80,600.
Trader's Question: Will Bitcoin confirm a further bearish extension below 79,253.95?
A sustained breakdown would strengthen the Elliott Wave bearish scenario toward 78,500, while a recovery above Fibonacci resistance could delay the projected decline.