
XAUUSD maintains a bearish outlook on the 4-hour chart, with the displayed price at 4,059.74. The Elliott Wave structure identifies blue wave iii near the recent low, followed by a developing corrective rebound toward the projected blue wave iv. Compared with our earlier October 27 analysis, price has recovered from 4,023.11, bringing the anticipated retracement closer to completion. The updated chart marks the 50.0% Fibonacci level near 4,060, replacing the earlier 38.2% reference. The projected path anticipates renewed selling in blue wave v toward approximately 3,950, completing the labeled purple (iii). The downside reference at 3,975.63 remains relevant, while 4,106.24 defines the annotated invalidation level.
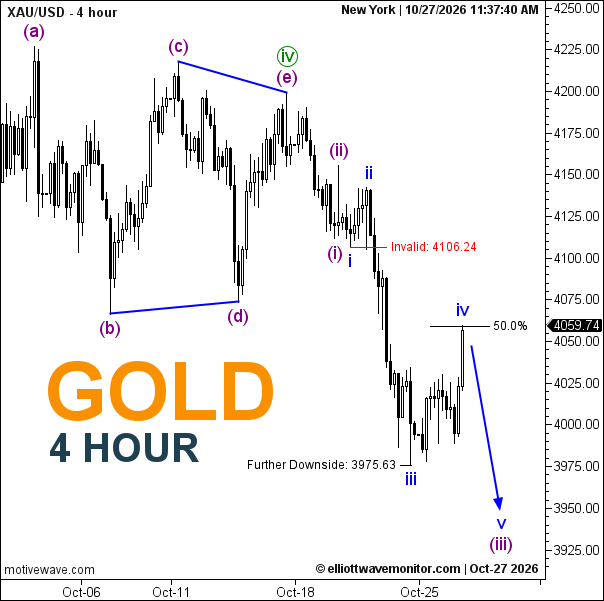
Technical Summary of Gold Price for October 27, 2026
-
Trend: Bearish.
-
Current Elliott Wave: Blue iii labeled; blue iv corrective rebound and v decline projected within purple (iii).
-
Key Support Levels: 3,975.63; approximately 3,950 projected.
-
Key Resistance Levels: Approximately 4,060; 4,106.24.
-
Next Price Target: Approximately 4,060 corrective resistance, then 3,975.63 and 3,950.
-
Invalidation Level: 4,106.24.
-
Fibonacci Levels: 50.0% retracement near 4,060.
Trader's Question: Is Gold approaching the completion of corrective wave iv?
The recovery toward the 50.0% Fibonacci retracement supports the projected corrective scenario, but wave iv completion requires confirmation through renewed selling pressure.