
Gold Rate stood at $4,171.66 on the supplied 4-hour chart, with sellers regaining control following a corrective recovery. The Gold Chart shows resistance at $4,217.46 and $4,226.71, while $4,110.84 and $4,066.48 remain important support levels.
Gold Elliott Wave Analysis, Fibonacci Levels and Gold News
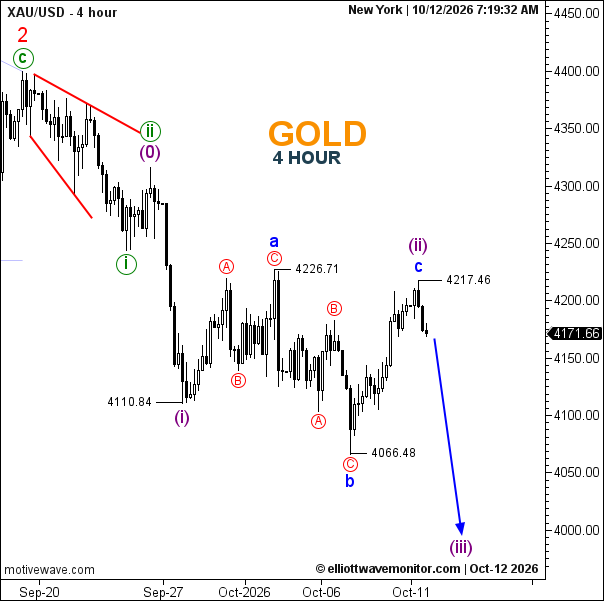
The Gold Elliott Wave count suggests wave (i) completed at $4,110.84, followed by a complex wave (ii) correction. Its internal structure features wave a at $4,226.71, wave b at $4,066.48, and wave c potentially terminating at $4,217.46.
A renewed decline could mark the beginning of wave (iii), with $4,066.48 serving as the first major downside reference and the $4,000 region representing a projected objective. A sustained break above $4,226.71 would weaken the immediate bearish interpretation and favor an extended correction.
The latest rebound retraced approximately 94.3% of the $4,226.71–$4,066.48 decline, indicating a deep corrective recovery. This Fibonacci measurement does not independently confirm completion of wave (ii).
Gold News remains dominated by US dollar strength and uncertainty surrounding Federal Reserve policy. Markets await Wednesday’s US CPI report and Thursday’s PPI and retail sales releases. Stronger inflation could support Treasury yields and pressure gold, while softer readings could challenge the bearish scenario.