
NASDAQ 100 remains bearish on the 4-hour chart, with the displayed price at 29,109.45. The Elliott Wave count preserves the completed decline labeled blue i–v, ending at purple wave (i), followed by a W-X-Y correction completing wave (ii). The subsequent decline is labeled blue wave i, while wave ii is projected toward the 50% Fibonacci area near 29,400 before another downward extension. Since October 23, price has stabilized near 29,100, but no bullish structural reversal is confirmed. The chart identifies 28,841.64 as a further-downside objective, with the blue projection extending toward approximately 28,700. A sustained break below 28,841.64 would reinforce bearish continuation, while recovery above 29,956.73 would invalidate the annotated bearish setup.
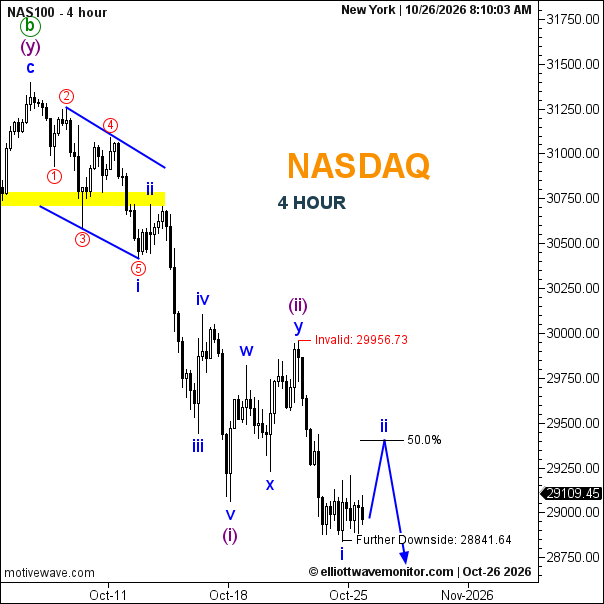
Technical Summary of NASDAQ 100 Price for October 26, 2026
-
Trend: Bearish.
-
Current Elliott Wave: Blue wave i labeled after purple (ii); blue wave ii projected upward.
-
Key Support Levels: 28,841.64 (annotated downside objective); approximately 28,700 (projected).
-
Key Resistance Levels: Approximately 29,400 (50% Fibonacci); 29,956.73.
-
Next Price Target: Approximately 29,400 rebound, followed by 28,841.64 and potentially 28,700.
-
Invalidation Level: 29,956.73 (annotated).
-
Fibonacci Levels: 50.0% retracement near 29,400, projected wave ii resistance.
Trader's Question: Can NASDAQ 100 complete wave ii before another bearish extension?
A rejection near the 50% Fibonacci retracement would support renewed selling pressure, while a break below 28,841.64 would strengthen the projected decline.