
The Nasdaq 100 (NAS100) has continued its corrective recovery, rising from 29,435.11 in the October 27 report to 29,682.43 on the updated 4-hour chart. This advance has carried price beyond the previously anticipated 61.8% Fibonacci retracement near 29,550, without breaching the established invalidation level. The updated Elliott Wave structure identifies the recent recovery as blue wave ii, following the decline into blue wave i, while purple (ii) remains labeled at the earlier corrective high. Despite the stronger rebound, the bearish scenario remains intact below 29,956.73. The newly drawn downward projection anticipates renewed weakness toward 28,841.64, although a reversal from the current recovery has not yet been confirmed.
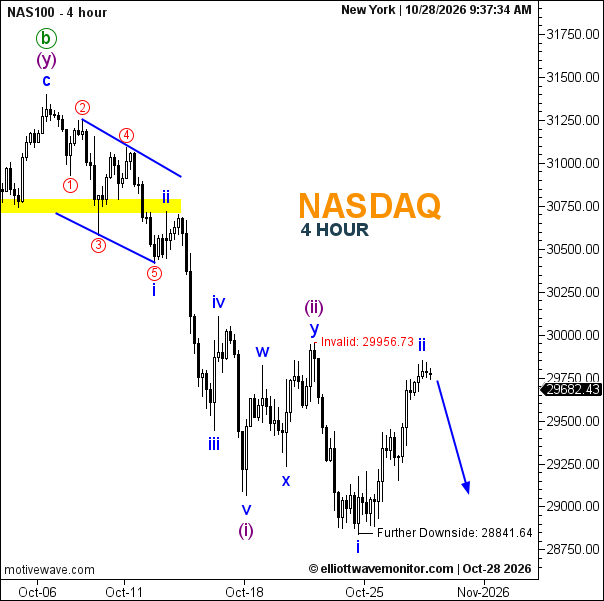
Technical Summary of Nasdaq 100 Price for October 28, 2026
-
Trend: Bearish.
-
Current Elliott Wave: Blue i labeled; blue ii corrective recovery near its projected endpoint.
-
Key Support Levels: Approximately 29,000; 28,841.64.
-
Key Resistance Levels: Approximately 29,750; 29,956.73.
-
Next Price Target: 28,841.64.
-
Invalidation Level: 29,956.73.