
Nasdaq stands at 29,918.75 on the four-hour chart after a sharp decline from 31,400.63. The count places the completed b wave at that peak, followed by a bearish sequence. Wave (i) appears as a leading diagonal, while the subsequent decline extends through (iii). The rebound labelled (iv) may be nearing completion, leaving scope for (v) toward the 29,400 area. Breaking the (iii) low would support this continuation; exceeding the (iv) high would challenge its proposed completion.
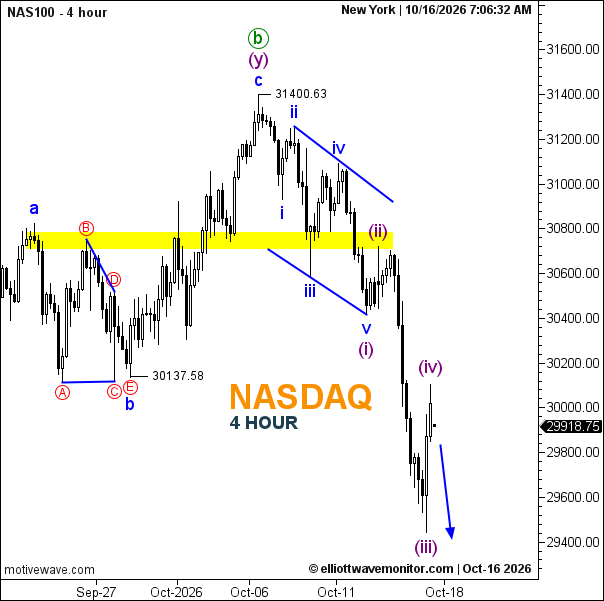
- Trend: Bearish; the current rebound is corrective.
- Trading Range: Approximately 29,400–30,100.
- Wave Structure: (i)–(ii)–(iii) labelled; (iv) potentially complete, with (v) anticipated.
- Support: Approximately 29,400 around the (iii) low.
- Resistance: The (iv) high near 30,100, then 30,137.58.