
The S&P 500 (SPX500) has advanced from 7,728.80 in the October 27 report to 7,732.63, bringing its corrective recovery into the previously identified 50.0% Fibonacci resistance area near 7,730. This development aligns with the earlier forecast, which anticipated a rebound toward Fibonacci resistance before a potential bearish continuation. The updated 4-hour chart now labels the recovery as purple wave 2, following purple wave 1 at the recent low, while the preceding blue five-wave decline remains unchanged. The downward projection suggests that resistance near the current level could initiate another decline toward 7,611.27. However, a bearish reversal still requires confirmation, and the scenario remains valid only below the marked invalidation level at 7,843.89.
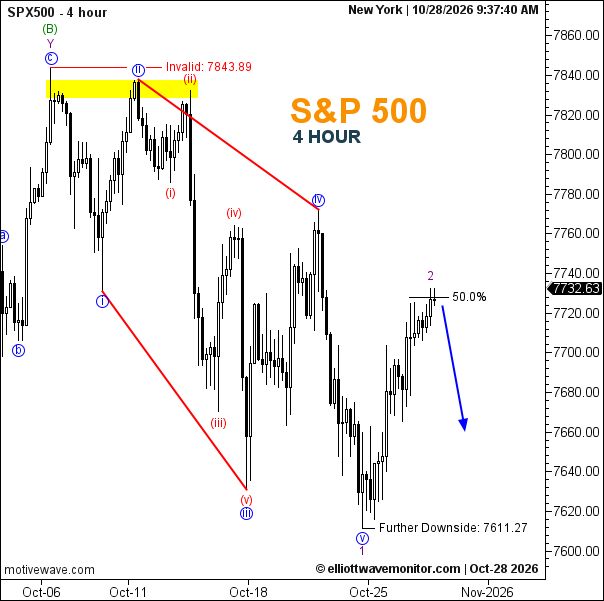
Technical Summary of S&P 500 Price for October 28, 2026
-
Trend: Bearish.
-
Current Elliott Wave: Purple wave 1 labeled; purple wave 2 corrective recovery near 50.0% Fibonacci resistance.
-
Key Support Levels: Approximately 7,620; 7,611.27.
-
Key Resistance Levels: Approximately 7,730–7,740; 7,843.89.
-
Next Price Target: 7,611.27.
-
Invalidation Level: 7,843.89.
-
Fibonacci Levels: 50.0% retracement near 7,730.