
The S&P 500 maintains a bearish outlook at the displayed 7,640.61, following rejection from the 7,843.89 resistance area. The Elliott Wave count shows the completed blue wave (ii), followed by a decline labeled blue (i)–(v), with wave (v) near 7,611.27. Since October 23, the bearish scenario has progressed, although the previous projected decline remains incomplete. The blue path anticipates a corrective wave 2 rebound toward the 50% Fibonacci retracement near 7,725, followed by renewed selling pressure below 7,611.27. A sustained break beneath that low would reinforce bearish continuation, while recovery above the annotated 7,843.89 invalidation level would challenge the current count.
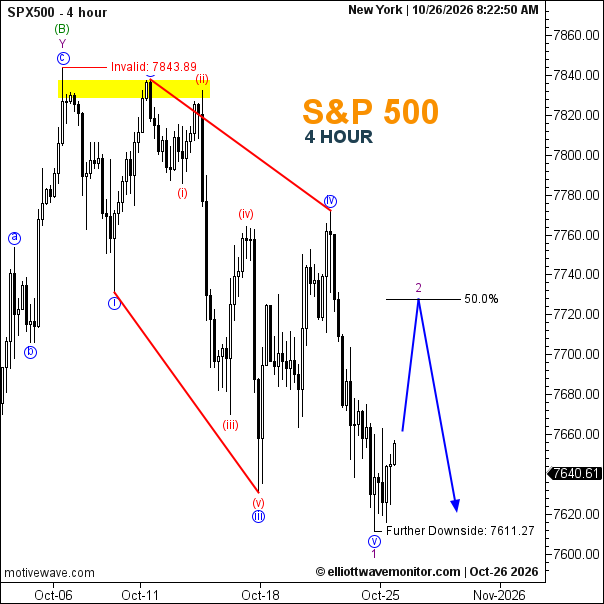
Technical Summary of S&P 500 Price for October 26, 2026
-
Trend: Bearish.
-
Current Elliott Wave: Blue wave (v) labeled; purple wave 2 projected upward.
-
Key Support Levels: 7,611.27 (annotated downside level).
-
Key Resistance Levels: Approximately 7,725 (50% Fibonacci); 7,843.89.
-
Next Price Target: 7,725 corrective rebound, then a potential decline below 7,611.27.
-
Invalidation Level: 7,843.89 (annotated).
-
Fibonacci Levels: 50.0% retracement near 7,725.
Trader's Question: Can the S&P 500 complete wave 2 before resuming its decline?
A rejection near the 50% retracement would support the projected bearish continuation, while a break below 7,611.27 would provide stronger confirmation.