
The Dow Jones (US30) has extended its corrective rebound from the previous session, advancing from 52,405 to 52,510 on the 4-hour chart. Unlike the October 27 forecast, which anticipated a recovery toward the 50.0% Fibonacci retracement near 52,550, the updated chart places resistance at the 61.8% retracement near 52,600. The broader bearish scenario remains unchanged following the labeled blue Z and purple (x) high. Price is consolidating beneath Fibonacci resistance, while the newly drawn downward arrow favors renewed selling toward 52,053. A rejection from the current resistance area would support this outlook, whereas a move above 52,976 would invalidate the displayed bearish scenario.
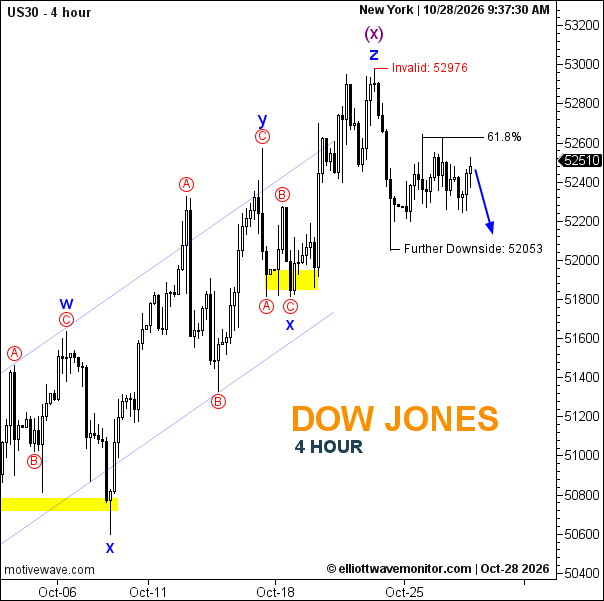
Technical Summary of Dow Jones Price for October 28, 2026
-
Trend: Bearish, corrective.
-
Current Elliott Wave: Blue Z and purple (x) labeled; subsequent bearish correction remains active.
-
Key Support Levels: 52,053; approximately 51,800.
-
Key Resistance Levels: Approximately 52,600; 52,976.
-
Next Price Target: 52,053.
-
Invalidation Level: 52,976.
-
Fibonacci Levels: 61.8% retracement near 52,600.