
The Dow Jones maintains a bearish outlook on the 4-hour chart, with the displayed price at 52,432 following rejection from the wave Z/(x) peak near 52,976. The Elliott Wave count identifies the completed W-X-Y-X-Z advance and a subsequent decline labeled blue wave i, followed by a developing wave ii rebound. Since October 23, the projected correction has progressed, while the recovery remains below the previous peak. The blue projection anticipates wave ii reaching the 50.0%–61.8% Fibonacci zone near 52,550–52,650 before renewed selling pressure toward approximately 51,650. A break below the annotated 52,053 downside reference would strengthen bearish continuation, whereas recovery above 52,976 would invalidate the marked bearish scenario.
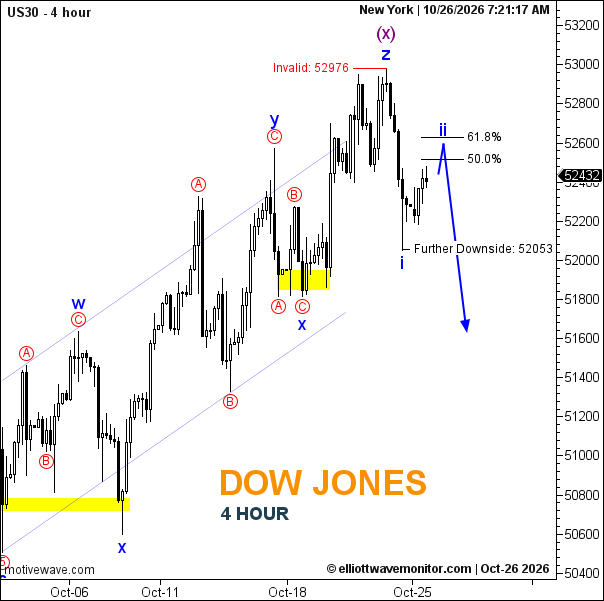
Technical Summary of Dow Jones Price for October 26, 2026
-
Trend: Bearish; corrective rebound developing.
-
Current Elliott Wave: Blue wave ii projected after wave i.
-
Key Support Levels: 52,053 (annotated downside reference); 51,650 (projected).
-
Key Resistance Levels: 52,550–52,650 (Fibonacci zone); 52,976.
-
Next Price Target: 52,550–52,650 rebound, followed by approximately 51,650 downside.
-
Invalidation Level: 52,976 (annotated).
-
Fibonacci Levels: 50.0% near 52,550; 61.8% near 52,650.
Trader's Question: Can the Dow Jones complete wave ii before resuming its decline?
A rejection within the 50.0%–61.8% Fibonacci zone would support the projected bearish continuation, particularly if price subsequently breaks below 52,053.