
USDCAD remains in a downward trend on the 4-hour chart, with the latest decline reaching the area labeled green a and purple (x), following the earlier purple (w) recovery. Price is trading near 1.39875, just above the marked 1.39701 low. The Elliott Wave projection anticipates a corrective rebound toward the 50.0% Fibonacci retracement near 1.41350, where green b and purple (y) are projected to form. This recovery would remain corrective within the broader bearish structure rather than confirming a trend reversal. Following the projected rebound, the blue arrow indicates renewed downside pressure toward 1.39685 and potentially lower. The bullish correction remains unconfirmed, while 1.42999 is retained as the chart's marked invalidation level.
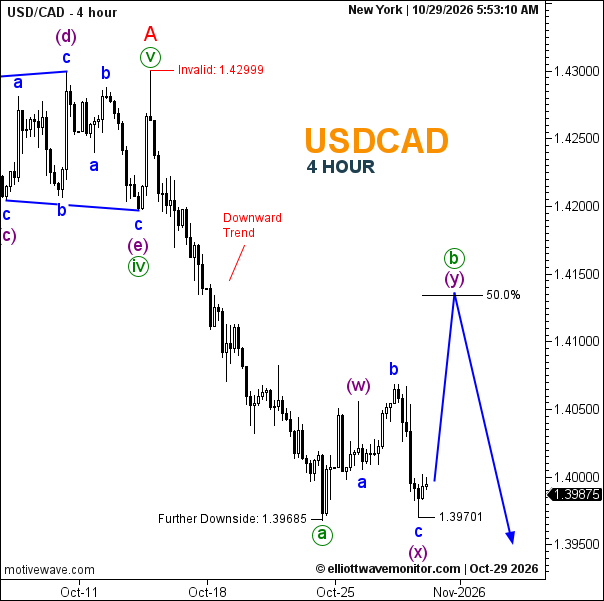
Technical Summary of USDCAD for October 29, 2026
-
Trend: Bearish; corrective rebound projected.
-
Current Elliott Wave: Green a and purple (x) labeled; green b and purple (y) projected.
-
Key Support Levels: 1.39701; 1.39685.
-
Key Resistance Levels: Approximately 1.40500; 1.41350.
-
Next Price Target: Approximately 1.41350, followed by a projected decline below 1.39685.
-
Invalidation Level: 1.42999.
-
Fibonacci Levels: 50.0% retracement near 1.41350.