
- US spot Bitcoin and Ethereum ETFs recorded approximately $150.8 million in combined net outflows on October 12, underscoring continued caution among institutional investors.
-
Bitcoin's four-hour Elliott Wave structure points toward a possible final decline into the $79,000–$78,000 region.
-
Ethereum remains vulnerable below its corrective resistance, with wave v potentially targeting $2,350–$2,300.
Crypto Market News: ETF Withdrawals Challenge Bitcoin and Ethereum Recovery
Bitcoin and Ethereum recovered from weaker opening levels on Tuesday, October 13, but the rebound unfolded against a challenging institutional backdrop.
US spot Bitcoin ETFs registered $65.4 million in net outflows on Monday, while Ethereum funds lost $85.4 million. The combined withdrawals reached approximately $150.8 million, adding to the pressure seen during the preceding week.
Earlier Tuesday, Bitcoin traded around $83,121 and Ethereum near $2,491, according to market quotations recorded at approximately 7:12 a.m. Eastern Time.
The broader macroeconomic environment remains uncertain. Elevated Treasury yields, volatility in technology stocks and changing expectations for Federal Reserve policy continue to influence risk appetite.
Investors are also preparing for the September US Consumer Price Index on October 14. A stronger-than-expected inflation reading could reinforce concerns about restrictive monetary conditions, although the market reaction will depend on expectations and the details of the report.
Bitcoin Elliott Wave Analysis: Wave (c) Remains Incomplete Below $84,261.95
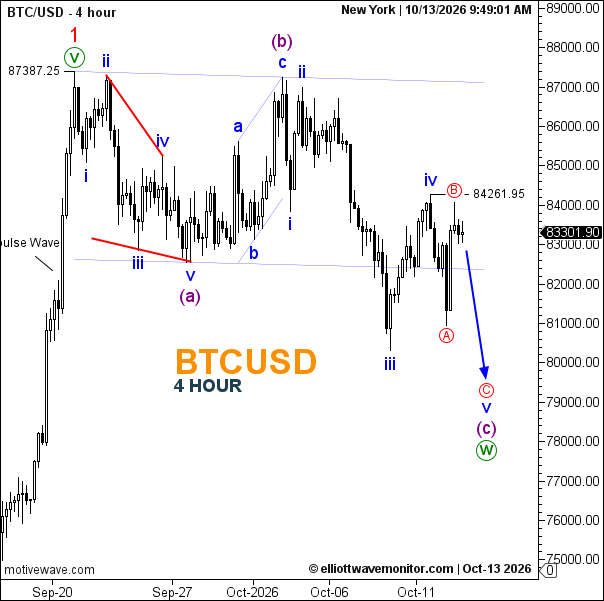
Bitcoin's four-hour chart shows an earlier impulsive advance terminating at $87,387.25, followed by a corrective sequence labeled (a)–(b)–(c) within the larger wave (w).
Wave (a) developed through five downward subdivisions. Wave (b) subsequently recovered toward the $87,000 region before sellers regained control.
The ongoing wave (c) appears to be developing as another five-wave decline. Waves i, ii and iii are visible, followed by a corrective wave iv that reached the $84,261.95 area.
The latest wave iv structure includes an internal A–B–C rebound, suggesting that the correction may be approaching completion.
At the chart's reference price of $83,301.90, the bearish scenario anticipates a final wave v decline toward approximately $79,000–$78,000, potentially completing wave (c) and the broader wave (w).
A sustained break below the recent wave iii low would strengthen the bearish count. Conversely, a recovery above $84,261.95 would challenge the proposed completion of wave iv, while a move beyond the earlier wave ii high near $87,000 would invalidate the current wave (c) impulse interpretation.
Ethereum Elliott Wave Analysis: Fibonacci Rejection Favors Wave v
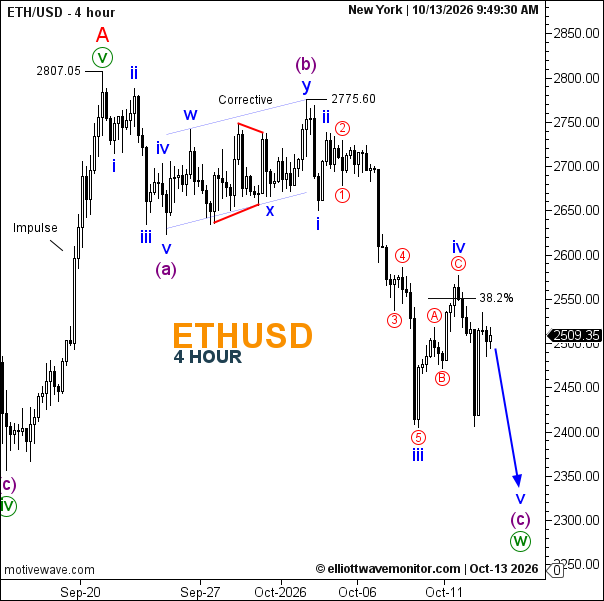
Ethereum's four-hour chart identifies a previous impulsive advance ending at $2,807.05, followed by a corrective decline.
Wave (a) unfolded downward, while wave (b) recovered to $2,775.60 through a complex corrective structure.
The current wave (c) is subdividing into a bearish five-wave impulse. Wave iii extended toward the $2,400 region before wave iv rebounded in an A–B–C formation toward the 38.2% Fibonacci retracement near $2,550.
With Ethereum quoted at $2,509.35 on the chart, the rejection from that retracement area supports the possibility that wave iv has ended.
The projected wave v decline targets approximately $2,350–$2,300, where wave (c) and potentially the larger wave (w) could conclude.
A sustained recovery above the wave iv high near $2,560 would weaken the immediate downside outlook. A break beyond the wave ii high around $2,775.60 would invalidate the current bearish impulse interpretation.
Bitcoin and Ethereum Outlook: Final Downward Wave Could Precede a Recovery
Both charts suggest that the broader corrective decline may be approaching its final stage, although neither wave v completion is confirmed.
For Bitcoin, $84,261.95 is the immediate corrective reference, while Ethereum must remain below its recent wave iv high to preserve the projected downside path.
If the final declines unfold, the indicated target zones may become areas to watch for corrective exhaustion and a subsequent rebound.
ETF flows, inflation expectations and broader risk sentiment could influence the timing and strength of these movements.