-
Bitcoin and Ethereum began October 12 amid mixed institutional demand, with both assets sensitive to oil prices and the upcoming US inflation report.
-
Bitcoin's four-hour structure favors a final decline toward $79,000–$78,000, potentially completing corrective wave (w).
-
Ethereum's rebound toward the 38.2% Fibonacci retracement may precede wave v, with a projected downside zone around $2,350–$2,300.
Crypto News: ETF Withdrawals and Inflation Expectations Shape Sentiment
Bitcoin recovered toward $84,000 earlier Monday as softer oil prices improved risk appetite, while Ethereum also participated in the broader cryptocurrency rebound. However, institutional flows remain uneven.
US spot Bitcoin ETFs recorded approximately $679 million in net withdrawals during October 5–9, despite attracting $21.1 million on Friday. Ethereum ETFs experienced approximately $542 million in weekly outflows, including $56.1 million on October 9.
Meanwhile, September's US Consumer Price Index is scheduled for October 14, followed by the Producer Price Index on October 15. Elevated inflation could reinforce expectations of restrictive Federal Reserve policy, potentially pressuring risk-sensitive assets.
Bitcoin Elliott Wave Analysis: Final Wave v Targets Lower Support
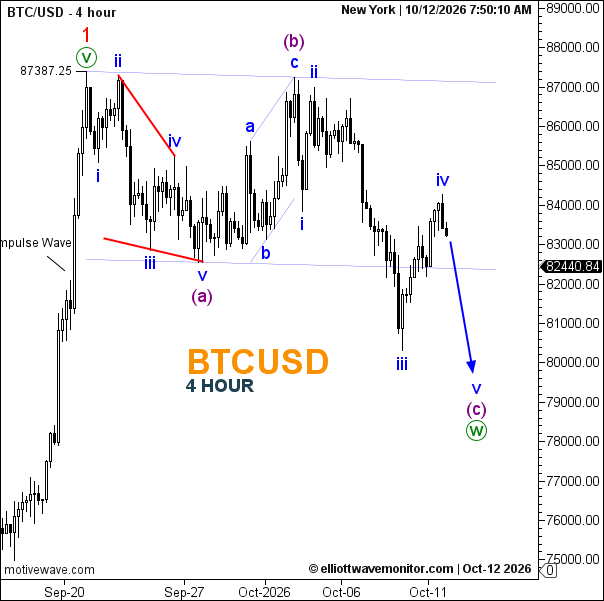
The BTC/USD four-hour chart identifies a completed five-wave advance ending at $87,387.25, labeled wave 1. The subsequent corrective decline is developing through waves (a), (b) and (c), potentially forming a larger wave (w).
Wave (a) unfolded as a five-wave decline, followed by a corrective wave (b) recovery toward the $87,000 region.
Wave (c) now appears to be forming another bearish five-wave sequence. Following waves i and ii, wave iii fell toward the $80,000–$81,000 region, while wave iv rebounded toward $84,000.
At the chart's latest reading of $82,440.84, the recovery has weakened, leaving scope for wave v to extend beneath the wave iii low.
The projected completion area lies around $79,000–$78,000. This is a chart-derived estimate rather than a confirmed Fibonacci objective.
A sustained advance above the wave iv high would delay the immediate bearish outlook, while a move above the wave ii peak near $87,000 would invalidate the current bearish impulse count.
Ethereum Elliott Wave Analysis: Wave iv Nears 38.2% Retracement
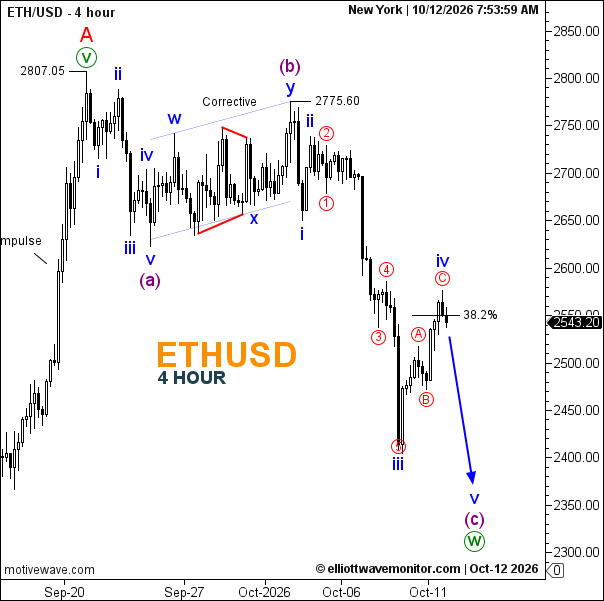
Ethereum's four-hour chart shows a similar corrective sequence following the completion of wave A at $2,807.05.
Wave (a) developed downward, while wave (b) recovered to $2,775.60 through a complex corrective structure.
The ongoing wave (c) is subdividing into a bearish impulse. Wave iii produced a sharp decline toward $2,400, followed by wave iv's corrective recovery toward the 38.2% Fibonacci retracement.
With ETH/USD at $2,543.20 on the supplied chart, sellers retain the broader short-term advantage, although the rebound must finish before the next downward leg can be confirmed.
A rejection near the $2,550–$2,600 resistance region could precede wave v, potentially extending toward approximately $2,350–$2,300 and completing wave (c) of the larger wave (w).
A sustained recovery above the wave iv region would challenge the immediate decline, while a move beyond the wave ii high near $2,775.60 would invalidate the current bearish impulse interpretation.
Bitcoin and Ethereum Outlook: Watching for Corrective Completion
Both assets exhibit potentially incomplete five-wave declines within larger corrective structures. Their projected downside targets may therefore represent areas where selling pressure begins to exhaust rather than the start of an indefinite bearish trend.
The decisive evidence will come from price behavior around the wave iv highs and subsequent breaks beneath the wave iii lows.
US inflation data, ETF flows and changes in oil prices may affect the timing and intensity of these movements, but the Elliott Wave counts remain conditional until confirmed by price action.