
Bitcoin is trading at 77,939.7 on the 1-hour chart, with a visible daily open of 77,437.1, representing a 0.65% increase since the day opened. The intraday range extends from 77,386.8 to 78,136.2, while the latest recovery follows a decline toward the 76,330.1 support area.
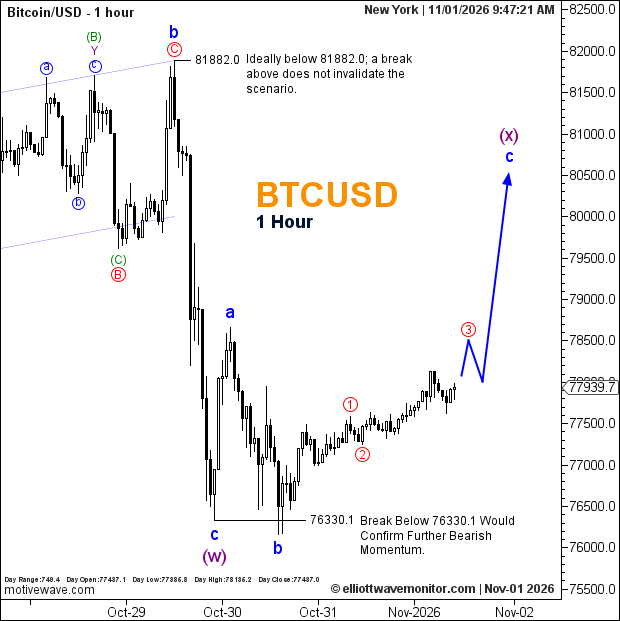
The updated Elliott Wave structure shows blue waves a, b, and c forming the completed purple (w) correction, followed by a developing upward sequence labeled red 1 and 2, with red 3 projected. The broader recovery targets blue c and purple (x) near the 80,500 region, although these projected endpoints remain unconfirmed. The earlier blue b and red C high at 81,882.0 remains an important reference: the chart explicitly favors price staying below that level but states that exceeding it would not invalidate the scenario. A temporary pullback is projected after red 3 before another upward extension toward purple (x). Conversely, a break below 76,330.1 would confirm further bearish momentum and weaken the anticipated recovery.
Technical Summary of Bitcoin Price for November 1, 2026
-
Trend: Short-term bullish recovery within a broader corrective structure.
-
Current Elliott Wave: Purple (w) labeled at the low; red 1 and 2 labeled, red 3 and purple (x) projected.
-
Key Support Levels: 77,386.8 (intraday low); 76,330.1.
-
Key Resistance Levels: 78,136.2 (intraday high); 81,882.0 (preferred upper reference).
-
Next Price Target: Approximately 80,500, at projected blue c and purple (x).
-
Trading Range: 77,386.8–78,136.2 (intraday range shown on the chart).
Trader Question: Is Bitcoin's current recovery a confirmed bullish reversal?
Not yet. The upward wave sequence remains developing, with red 3 and purple (x) still projected. The bullish recovery remains conditional, while a break below 76,330.1 would confirm renewed bearish momentum.