
The Dow Jones count has been fully revised. On the four-hour chart, price is 52,227, with the advance from 50,508 now labelled w–x–y within corrective wave (x). Wave y contains A–B–C: B is marked at 51,329, while C may extend toward approximately 52,750 before completing y and (x). The projected decline remains conditional on that completion. A break below 51,329 would strengthen the bearish reversal scenario; further upside would keep C developing.
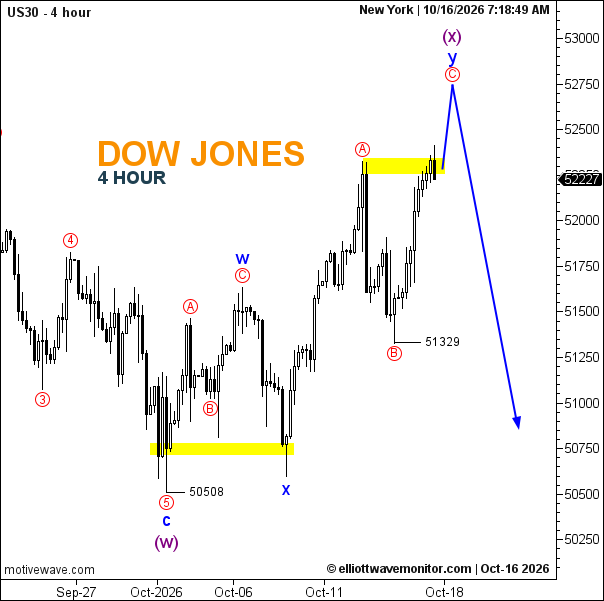
- Trend: Corrective rally, with a subsequent decline anticipated.
- Trading Range: Approximately 51,329–52,350.
- Wave Structure: (w) completed at 50,508; w–x–y forms the developing (x).
- Support: 51,329, then 50,508.
- Resistance: Around 52,300–52,350; projected C endpoint near 52,750.