
Key Points
- EUR/USD reached 1.12371, exceeding its previous upside reference.
- Blue waves i and ii are now labeled within the developing recovery.
- A brief pullback may precede another advance toward wave iii.
EURUSD Rate
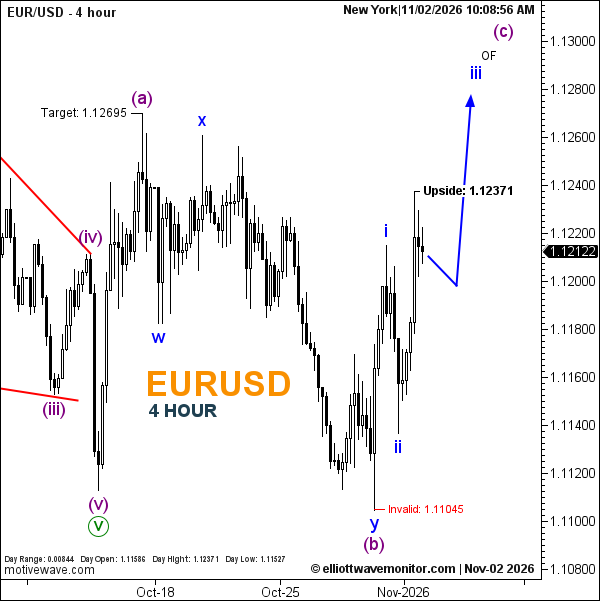
EUR/USD stood at 1.12122 at 10:08 a.m. New York time. The four-hour chart shows a daily opening price of 1.11586, with trading between 1.11527 and 1.12371.
EURUSD Elliott Wave Analysis
The recovery anticipated in the October 30 forex outlook has progressed beyond its initial upside objective, strengthening the case for further corrective gains.
The updated Elliott Wave count places blue wave y at the purple wave (b) low, followed by an initial advance labeled i and ii. This development shifts attention toward the projected third wave within the broader purple wave (c).
The blue forecast path allows a temporary retracement before renewed upside toward the area above the earlier 1.12695 wave (a) reference. However, the projected extension remains unconfirmed.
Technical Analysis for November 2, 2026
- Trend: Bullish corrective recovery.
- Wave Structure: Purple (b) labeled; blue iii projected within purple (c).
- Upside Reference: 1.12371.
- Previous Wave High Reference: 1.12695.
- Invalidation: 1.11045.
Trader's Question: Would a pullback below 1.12148 cancel the recovery outlook?
Not automatically. The projected path already anticipates a retracement, while 1.11045 remains the chart's explicit invalidation boundary.