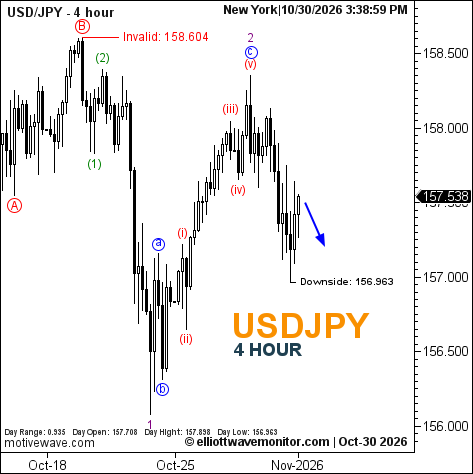
- USD/CAD is near its marked 1.39418 downside reference; USD/JPY resumes lower with 156.963 in view.
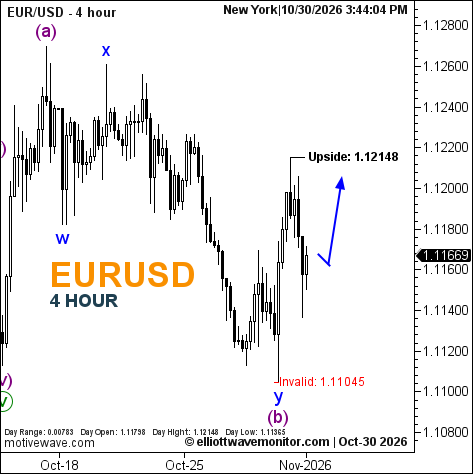
- EUR/USD and GBP/USD charts project renewed advances, capped by 1.12148 and 1.34340 references.
- AUD/USD may complete an upswing near 0.707 before a pullback toward 0.70094.
EURUSD Elliott Wave Analysis
AUDUSD Elliott Wave Analysis
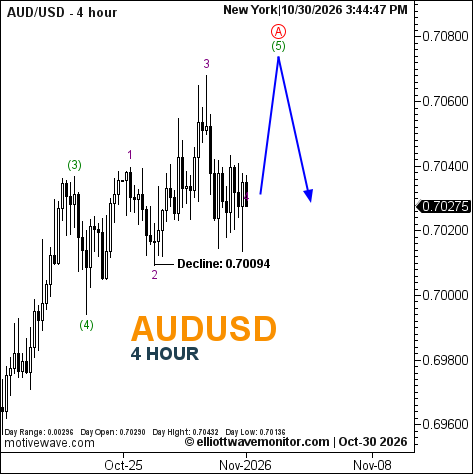
At 0.70275, AUD/USD is consolidating below its recent wave-3 high. The chart projects another advance in wave 5, with a red A top around 0.707–0.708, followed by a decline toward 0.70094. The price zones are visual estimates except for the explicitly marked decline reference. On October 27, the working path anticipated an A high near 0.705–0.706, a dip near 0.698 and a further rise. The current count instead places the near-term push higher first and labels the subsequent decline at 0.70094. A sustained break below that level would extend the correction beyond the first marked objective.
USDJPY Elliott Wave Analysis
USDCAD Elliott Wave Analysis
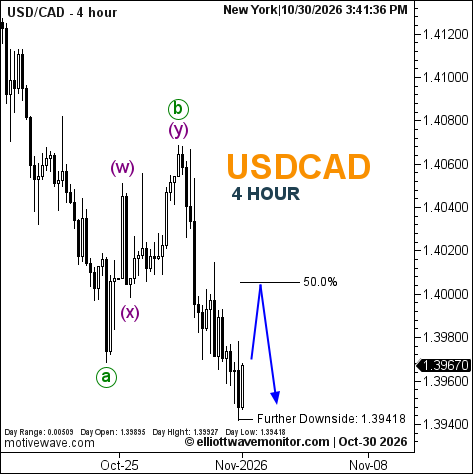
USD/CAD is 1.39670, extending the decline anticipated in the October 27 chart, which showed 1.39685 as further downside. The current count allows for a corrective bounce toward the 50% retracement near 1.4000, followed by another leg lower. The chart’s next downside reference is 1.39418. No formal invalidation is printed on this chart, so the 50% retracement is a resistance reference rather than a confirmed ceiling. A sustained move above the rebound zone would delay the immediate downside path; a rejection there would support the projected continuation lower.
GBPUSD Elliott Wave Analysis
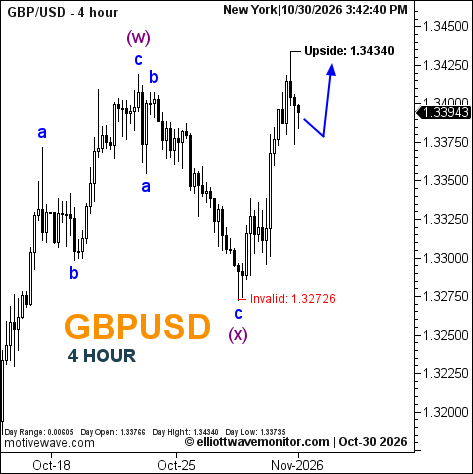
GBP/USD is 1.33943 after rallying from the 1.32726 low marked as invalidation. The chart shows the advance reaching 1.34340 and projects a modest pullback toward roughly 1.337–1.338 before another attempt higher. The 1.34340 label is the chart’s upside reference, while 1.32726 remains the explicit invalidation for the broader recovery. This follows through on the October 27 setup, which projected a wave (x) low near 1.327 and a wave (y) recovery toward 1.344–1.345. That rebound has now occurred; the current question is whether the shallow pullback can hold above the marked invalidation.