
Nasdaq 100 (NAS100) maintains a bearish outlook on the 4-hour chart, with the displayed price at 29,435.11. The Elliott Wave count identifies purple wave (i) at the recent low and purple (ii) at the subsequent corrective high, followed by a decline into blue wave i and an ongoing rebound toward blue wave ii. Compared with our previous analysis dated October 26, 2026, the rebound has developed toward the anticipated Fibonacci resistance zone, while the broader bearish scenario remains valid. The annotated path suggests a final corrective advance toward the 61.8% retracement near 29,550 before renewed selling pressure targets 28,841.64. The scenario remains valid below the marked invalidation level at 29,956.73.
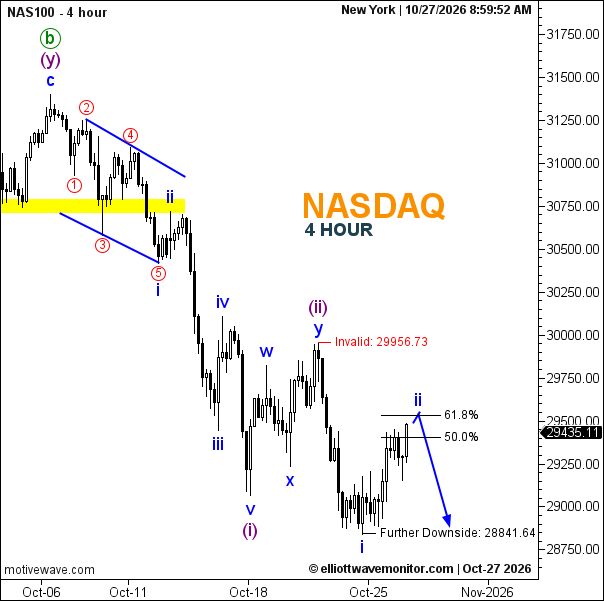
Technical Summary of Nasdaq 100 Price for October 27, 2026
-
Trend: Bearish.
-
Current Elliott Wave: Blue i labeled; blue ii projected following purple (ii).
-
Key Support Levels: 28,841.64; approximately 28,750.
-
Key Resistance Levels: 29,435–29,550; 29,956.73.
-
Next Price Target: Approximately 29,550 corrective rebound, then 28,841.64.
-
Invalidation Level: 29,956.73.
-
Fibonacci Levels: 50.0% near 29,400; 61.8% near 29,550.
Trader's Question: Will NAS100 complete its corrective rebound before resuming the decline?
The projected path favors a test of the 61.8% retracement before renewed weakness toward 28,841.64. A sustained break above 29,956.73 would invalidate the annotated bearish scenario.