
The S&P 500 four-hour chart shows a rebound to 7,756.36 after the low labelled iv. The count suggests a developing ending diagonal within (v), with iii marked at 7,843.89. The projected path allows a pullback toward approximately 7,720 before v advances toward 7,880–7,900. These remain prospective moves. A break above 7,843.89 would support continuation; losing the iv low would challenge the proposed completion of iv.
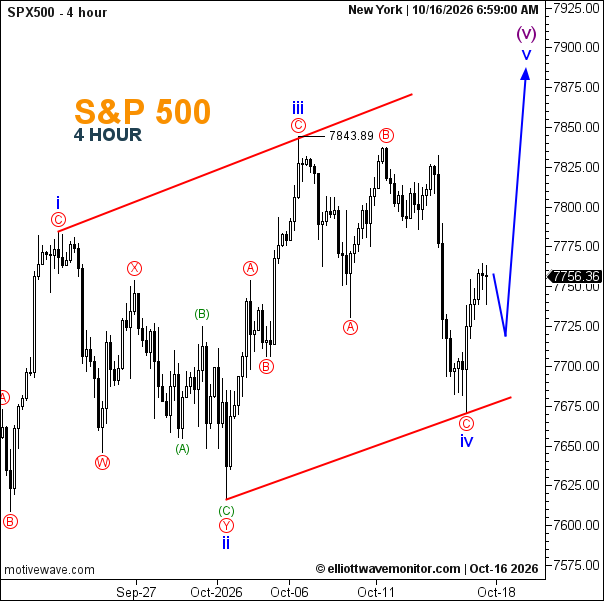
- Trend: Bullish recovery within a broader rising structure.
- Trading Range: Approximately 7,670–7,843.89.
- Wave Structure: i–ii–iii–iv labelled; v anticipated to complete (v).
- Support: Approximately 7,720, then 7,670 near the lower boundary.
- Resistance: 7,843.89, followed by the projected 7,880–7,900 area.