- The S&P 500’s move below 7,630.86 has invalidated the prior bullish count; the chart now allows a brief rebound before another decline.
- NAS100 and the Dow remain under pressure, with downside references at about 28,250 and 51,672.
- AI spending concerns and a busy week of earnings, elections and U.S. jobs data keep volatility risks elevated.
S&P 500 Elliott Wave Analysis
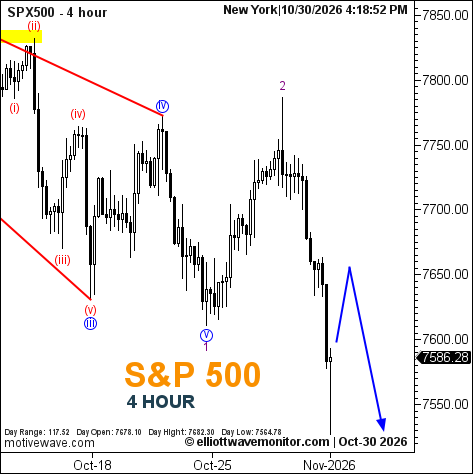
The S&P 500 chart reads 7,586.28 after a sharp decline. The October 20 bullish setup used 7,630.86 as its invalidation area; price has now broken below that level, so that count no longer holds. The current chart shows a descending sequence, a projected corrective bounce toward roughly 7,610–7,655, then another leg lower toward approximately 7,520. These arrow-derived zones are estimates, not labeled formal targets. A sustained recovery above the bounce area would delay the bearish continuation, while renewed selling would keep the lower path active.
NASDAQ Elliott Wave Analysis
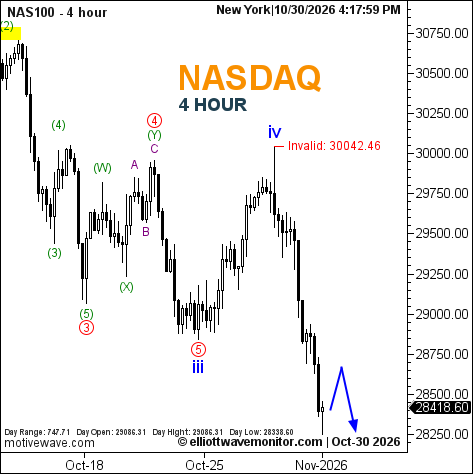
NAS100 is at 28,418.60 after falling beneath the prior chart’s 29,000 area. The current count marks a recovery high at 30,042.46 as invalidation and projects a modest rebound toward about 28,600, followed by further weakness toward roughly 28,250. The latter two levels are estimated from the drawn path. Compared with October 20, the expected decline below 29,000 has unfolded; the chart now places the corrective wave IV high at 30,042.46 and shows the next bearish leg underway. A move above 30,042.46 would invalidate this count.
Dow Jones Elliott Wave Analysis
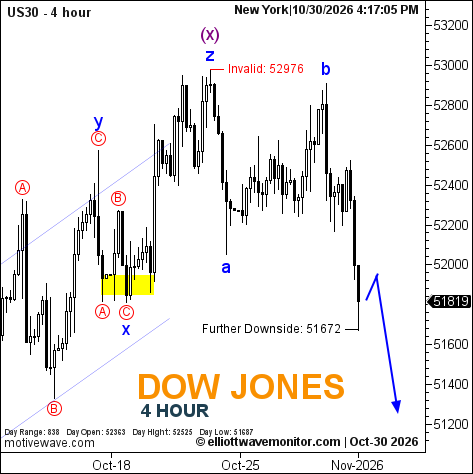
The Dow chart stands at 51,819 after falling from the marked 52,976 invalidation high. The current path allows a short rebound toward roughly 51,950–52,000 before another decline, with 51,672 explicitly marked as further downside. On October 20, the working count anticipated a final advance into the 52,900–53,000 region before a larger decline. Price reached that area and has since reversed, bringing the bearish phase into focus. A sustained move above 52,976 would invalidate the chart’s current decline scenario.
Market Outlook
The chart structures now lean lower across all three indexes, although each allows a near-term bounce. The S&P has already crossed below its previous 7,630.86 invalidation, while NAS100 and US30 retain explicit invalidation levels at 30,042.46 and 52,976. For the Nasdaq and Dow, the projected rebounds are corrective unless price breaks their marked ceilings. The next week’s earnings, election and employment headlines could widen intraday swings, so the chart paths should be reassessed as new information arrives. The exact 7,520 and 28,250 estimates come from visual arrows, not formal labels.