
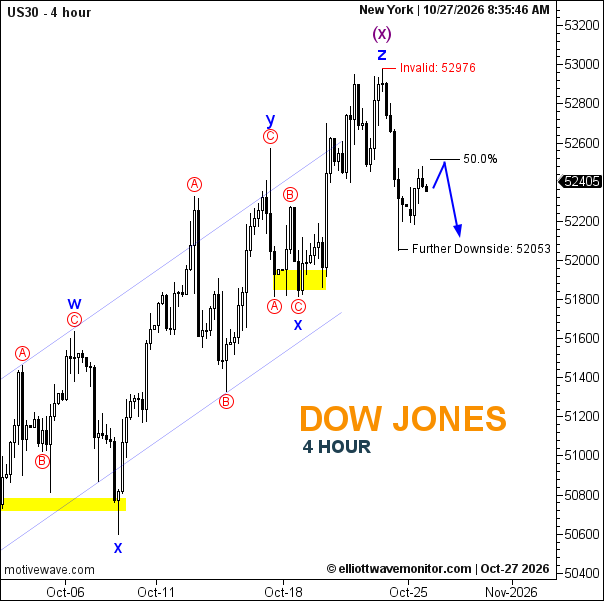
The Dow Jones (US30) shows a bearish corrective outlook on the 4-hour chart, with the displayed price at 52,405. The labeled W-X-Y-Z structure culminates in wave Z/(x) near 52,976, followed by a sharp decline and a modest rebound. Compared with our previous analysis dated October 26, 2026, the corrective rebound remains relevant, while the bearish continuation is not yet confirmed. The projected path suggests a recovery toward the 50.0% Fibonacci level near 52,550 before another decline toward the annotated 52,053 support. A sustained move above 52,976 would invalidate the displayed bearish scenario.
Technical Summary of Dow Jones Price for October 27, 2026
-
Trend: Bearish, corrective.
-
Current Elliott Wave: Z/(x) labeled; subsequent decline and rebound visible, without new wave labels.
-
Key Support Levels: 52,053; approximately 51,800.
-
Key Resistance Levels: Approximately 52,550; 52,976.
-
Next Price Target: Approximately 52,550 rebound, then 52,053.
-
Invalidation Level: 52,976.
-
Fibonacci Levels: 50.0% near 52,550.
Trader's Question: Will the Dow Jones rebound before extending its correction?
The projected recovery toward 52,550 may precede renewed selling toward 52,053. A sustained break above 52,976 would challenge this bearish outlook.