-
Wall Street enters October 12 with a narrowly led stock-market advance, while inflation data and major bank earnings present fresh tests for investor confidence.
-
Dow Jones is approaching a potential wave b peak near 51,800–51,900, ahead of a possible wave c decline toward 50,508.
-
Nasdaq 100 and S&P 500 may need one final fifth-wave advance before their respective corrective declines unfold.
Wall Street News: Inflation, Earnings and Market Breadth in Focus
US stock futures advanced modestly on Monday as oil prices eased, offering temporary relief from inflation concerns. Nevertheless, investors remain sensitive to elevated Treasury yields and uncertainty surrounding the Federal Reserve's next policy decision.
A Reuters report published October 12 highlighted the increasingly narrow character of the US equity rally. Although the S&P 500 has gained approximately 14% in 2026, more than 40% of its constituent stocks have declined, with technology and semiconductor shares accounting for a substantial portion of the index's gains.
The market now faces two important catalysts: third-quarter earnings from major US banks beginning October 13, and September's Consumer Price Index on October 14, followed by producer inflation figures on October 15.
Stronger inflation could intensify pressure from bond yields, while encouraging corporate earnings may help sustain the market's upward momentum.
Dow Jones Forecast: Wave b Approaches a Potential Reversal Zone
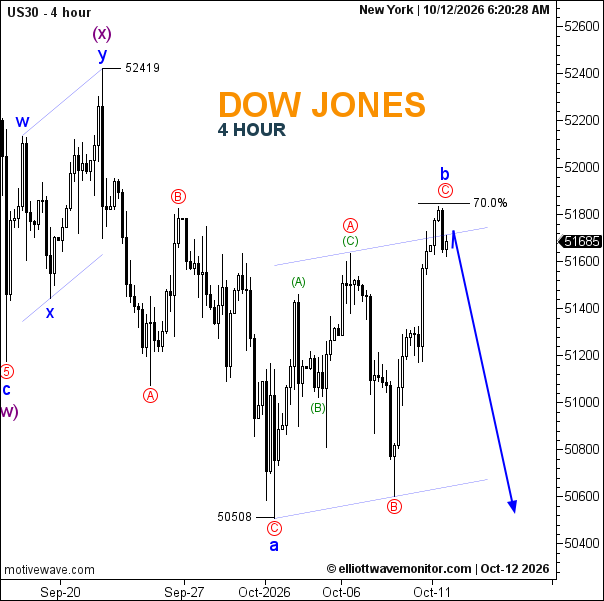
The Dow Jones 4-hour Elliott Wave chart shows a corrective recovery following the decline from 52,419 to 50,508.
Wave a ended at 50,508, while the ongoing wave b has developed as an A–B–C correction. Its final segment is approaching the 70% Fibonacci retracement area, around 51,800–51,900.
This resistance region represents a potential completion zone for wave b, rather than a confirmed reversal.
If bearish price action develops there, the index could begin wave c toward 50,508. A decisive break beneath that low would increase the likelihood of a deeper correction.
Conversely, sustained strength beyond 51,900 would suggest the rebound is extending and delay the projected decline.
Nasdaq 100 Forecast: Fifth Wave May Extend Above 31,400
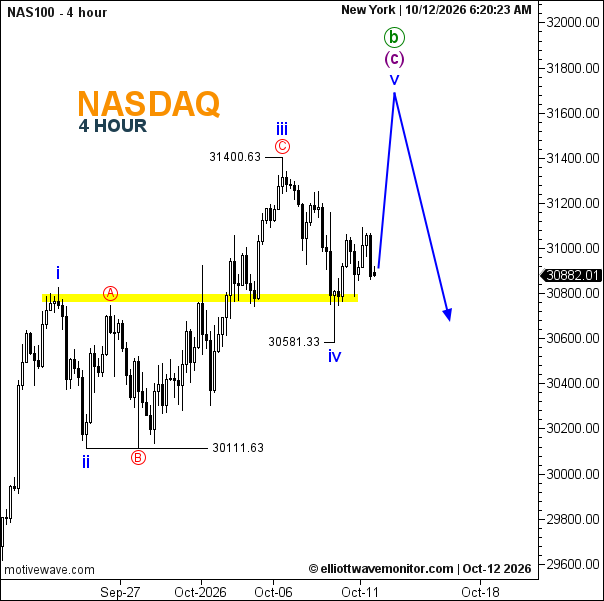
The Nasdaq 100 Elliott Wave structure suggests the recovery has not necessarily reached its final high.
Wave iii peaked at 31,400.63, followed by wave iv's correction to 30,581.33. Price subsequently recovered toward 30,894.64, leaving room for a developing wave v.
A move above 31,400.63 would support the possibility of a final advance toward the approximate 31,600–31,800 area, based on the chart's projected trajectory rather than a fixed Fibonacci target.
That advance could complete wave (c) within the larger wave b, opening the door to a bearish correction.
A premature decline beneath 30,581.33 would weaken the immediate fifth-wave outlook. Following a completed peak, the 30,800 region becomes an initial downside reference, with 30,111.63 a more distant structural level.
S&P 500 Forecast: One Final Push Before a Larger Correction?
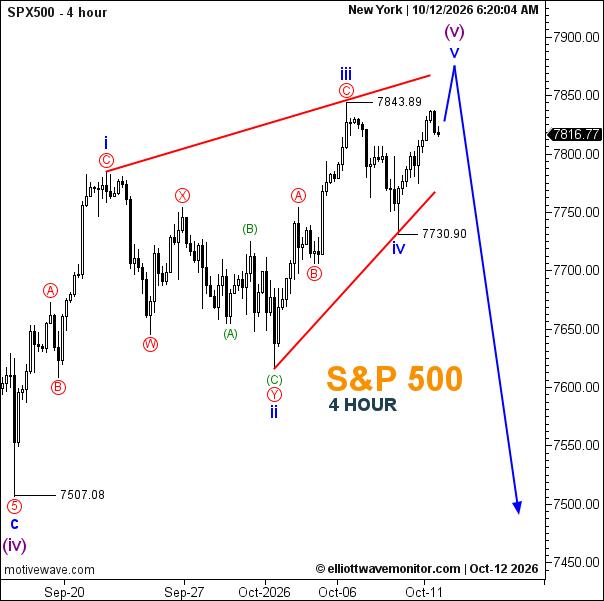
The S&P 500 4-hour chart presents a comparable late-stage Elliott Wave formation.
Wave iii reached 7,843.89, while wave iv retraced to 7,730.90. The latest recovery, with price around 7,820.27 on the supplied chart, may develop into wave v.
A breakout above 7,843.89 could extend toward approximately 7,850–7,880, completing the projected five-wave sequence.
Once the structure is complete, the chart anticipates a potentially substantial correction toward the 7,500 region. This remains conditional on a confirmed reversal rather than the mere appearance of a new high.
A break below 7,730.90 before the expected fifth-wave peak would challenge the current near-term interpretation.
Market Outlook: Watch for Confirmation, Not Just New Highs
The three indices suggest that US equities may be approaching a corrective turning point, but the expected timing differs.
Dow Jones appears closer to completing an upward correction. Nasdaq 100 and S&P 500 retain scope for additional gains before their respective structures are complete.
A reversal from resistance followed by breaks of relevant support levels would strengthen the bearish interpretation. Until those conditions emerge, the downside paths remain Elliott Wave projections rather than established trends.